Are you looking to get away from proprietary instrumentation?
Are you interested in open source observability but lack the knowledge to just dive right in?
This workshop is for you, designed to expand your knowledge and understanding of open source observability tooling that is available to you today.
Dive right into a free, online, self paced, hands-on workshop introducing you to Prometheus. Prometheus is an open source systems monitoring and alerting tool kit that enables you to hit the ground running with discovering, collecting, and querying your observability today. Over the course of this workshop you will learn what Prometheus is, what it is not, install it, start collecting metrics, and learn all the things you need to know to become effective at running Prometheus in your observability stack.
In this article you’ll be introduced to some basic concepts, learn what Prometheus is and what it is not before you start getting hands on with it in the rest of the workshop.
I’m going to get you started on your learning path with this first lab that provides a quick introduction to all things needed for metrics monitoring with Prometheus. Note this article is only a short summary, so please see the complete lab found online here to work through it in its entirety yourself:

The following is a short overview of what is in this specific lab of the workshop. Each lab starts with a goal, in this case it is fairly simple:
This lab introduces you to the Prometheus project and provides you with an understanding of its role in the cloud native observability community.
The start is with background on the beginnings of the Prometheus project and how it came to be part of the Cloud Native Computing Foundation (CNCF) as a graduated project. This leads to some basic outlining of what a data point is, how they are gathered, what makes them a metric and all using a high level metaphor.
You are then walked through what Prometheus is, why we are looking at this project as an open source solution for your cloud native observability solution, and more importantly, what Prometheus can not do for you.
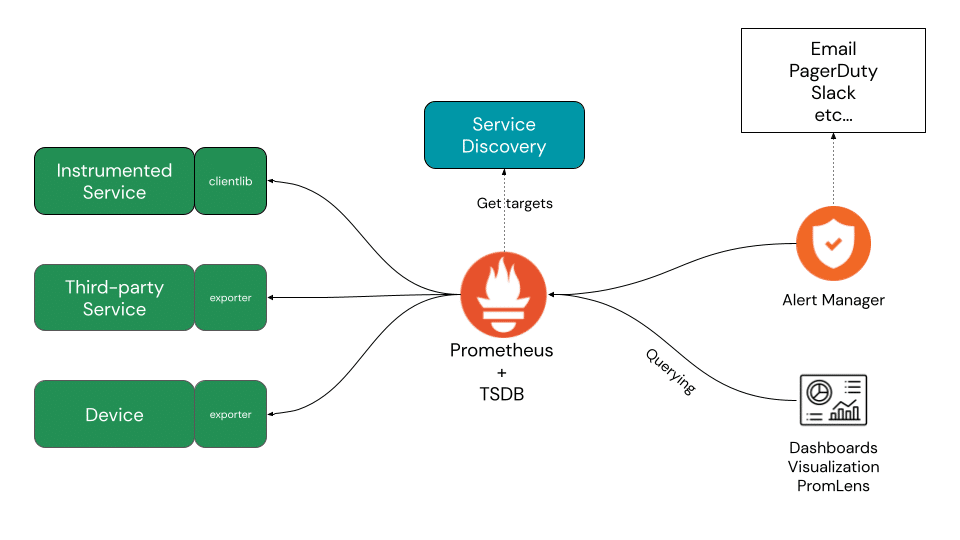
A basic architecture is presented walking you through the most common usage and components to a Prometheus metrics deployment. Below you see the final overview of the Prometheus architecture:

You are then presented an overview of all the powerful features and tools you’ll find in your new Prometheus toolbox:
- Dimensional data model – for multi-faceted tracking of metrics
- Query language – PromQL provides a powerful syntax to gather flexible answers across your gathered metrics data
- Time series processing – integration of metrics time series data processing and alerting
- Service discovery – integrated discovery of systems and services in dynamic environments
- Simplicity and efficiency – operational ease combined with implementation in Go language
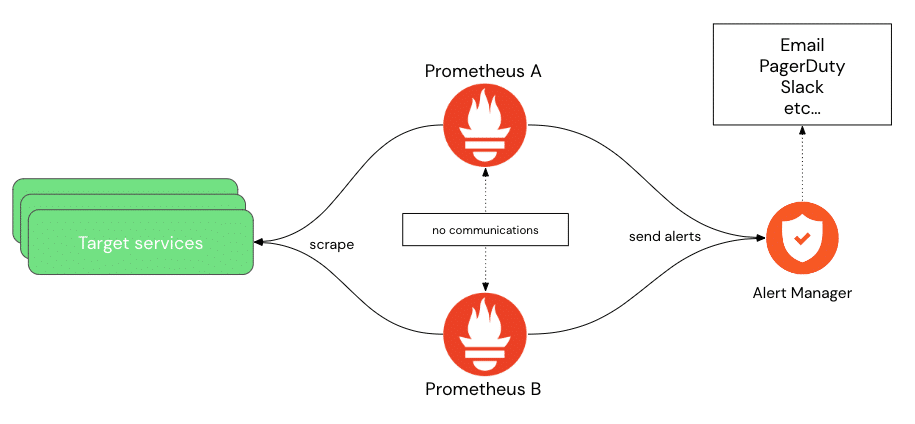
Finally, you’ll touch on the fact that Prometheus has a very simple design and functioning principle and that this has an impact on running it as a highly available (HA) component in your architecture.

This aspect is only briefly touched upon, but don’t worry, we cover this in more depth later in the workshop.
At the end of each lab, including this one, you are presented with the end state (in this case we have not yet done anything), a list of references for further reading, a list of ways to contact me for questions, and a link to the next lab.
Coming up next
I’ll be taking you through the following lab in this workshop where you’ll learn how to install and set up Prometheus on your own local machine. Stay tuned for more hands on material to help you with your cloud native observability journey.
Curious as to how Chronosphere can help you manage your Prometheus instances? Contact us for a demo.


