")

Build a Java logging pipeline with Fluent Bit
Java application logs can be very useful for debugging and understanding what is happening in your application. However, if you have a lot of logs, it can be challenging to analyze and understand them. That’s where Fluent Bit comes in.
Fluent Bit helps to solve this problem by providing a flexible and configurable logging pipeline that can parse, filter, and route logs to multiple destinations. This allows you to easily segregate and filter logs based on the information contained within them, making it easier to identify and troubleshoot issues.
In this blog, we will demonstrate a simple Java logging pipeline that uses Fluent Bit to send Java application logs to Elasticsearch.
Getting set up
For this demo, you will need to have Docker and Docker Compose installed. If you don’t have it already installed, you can follow the install docker-compose official documentation, which has very well-articulated steps.
You’ll also need an Elastic Cloud account; even a trial account would work for this demo. Sign up for a trial.
Once you’re done with the installation, let’s look at the Fluent bit configuration. The configuration below is fairly simple and not meant for production use.
Configure Fluent Bit
Fluent Bit can be configured using a configuration file or environment variables. The configuration file can be written in either YAML or classic mode, a simple syntax that resembles YAML. The configuration file allows for easy management of complex pipelines. YAML configuration has been production-ready since Fluent Bit v2.0, and some newer Fluent Bit features can only be utilized using YAML configuration files.
Environment variables can also be used to configure Fluent Bit, and they provide a simple way to pass configuration data without needing a configuration file. Once the configuration is set up, Fluent Bit can be run as a standalone process or as a sidecar in containerized environments.
For this demo, we will use a classic configuration file because we will need to apply a parser and the YAML configuration does not yet support parsers (as of Fluent Bit v3.0).
Create a file named fluent_bit.conf with the following content.
[SERVICE]
	flush 1
	log_level info
        parsers_file  parsers.conf
Input configuration
Fluent Bit accepts data from a variety of sources using input plugins. The tail input plugin allows you to read from a text log file as though you were running the tail -f command
Add the following to your fluent-bit.conf file below the Service section you created:
[SERVICE]
	flush     	1
	log_level 	INFO
	parsers_file  parsers.conf

[INPUT]
	name          	tail
	tag           	*
	path          	test.log
	multiline.parser java
	skip_empty_lines  On
	refresh_interval  5
	read_from_head   true
The plugin name, which identifies which plugin Fluent Bit should load, cannot be customized by the user. The tag parameter is optional but can be used for routing and filtering your data, as discussed in more detail below.
The path parameter in Fluent Bit’s configuration may need to be adjusted based on the source of your logs. In this case, we will be using a sample log file that we will create later.
Manning Book: Fluent Bit with Kubernetes
Learn how to optimize observability systems for Kubernetes. Download Fluent Bit with Kubernetes now!
Parser configuration
To ensure accurate log data is sent to Elasticsearch, it’s crucial to properly configure Fluent Bit to parse log messages. Failure to do so can result in incomplete or incorrect data being sent.
The challenge comes with multiline logs, which occur when information about a single event is written as multiple lines in the log file.
Without multiline parsing, Fluent Bit will treat each line of a multiline log message as a separate log record. This can lead to:
- Duplicated logs
- Loss of context
- Inability to extract structured data
To handle multiline log messages properly, we will need to configure the multiline parser in Fluent Bit. Depending on your log format, you can use the built-in or configurable multiline parser.
The regex filter can then be used to extract structured data from the parsed multiline log messages. The extracted fields can be used to enrich your log data.
We’ve covered this problem in more detail with examples of how to configure Fluent Bit to properly handle multiline logs in another blog post. If you are unfamiliar with the process, you should review that post before proceeding.
We will create a separate file for our parser configuration. Create a file named parser.conf that contains the following content:
[PARSER]
	Name   java_multi
	Format regex
	Regex           	^(?[0-9]{4}-[0-9]{2}-[0-9]{2}\s[0-9]{2}:[0-9]{2}:[0-9]{2}\.[0-9]{3})\s+(?\S+)\s+(?\S+)\s+---\s+\[\s*(?[^\]]+)\]\s+(?[^\s]+)\s+:\s+(?.+)$
	Time_Key        	timestamp
	Time_Format     	%Y-%m-%d %H:%M:%S.%L
	Time_Keep       	On
Filter configuration
Next, we apply a filter that takes our unstructured logs, runs them through the ‘java_multi’ parser that we configured above, and turns them into structured XML data that we can then routed to our intended destination for ingestion.
[FILTER]
	name         	parser
	match        	*
	key_name     	log
	parser       	java_multi
Output configuration for Elasticsearch
As with inputs, Fluent Bit uses output plugins to send the gathered data to their desired destinations.
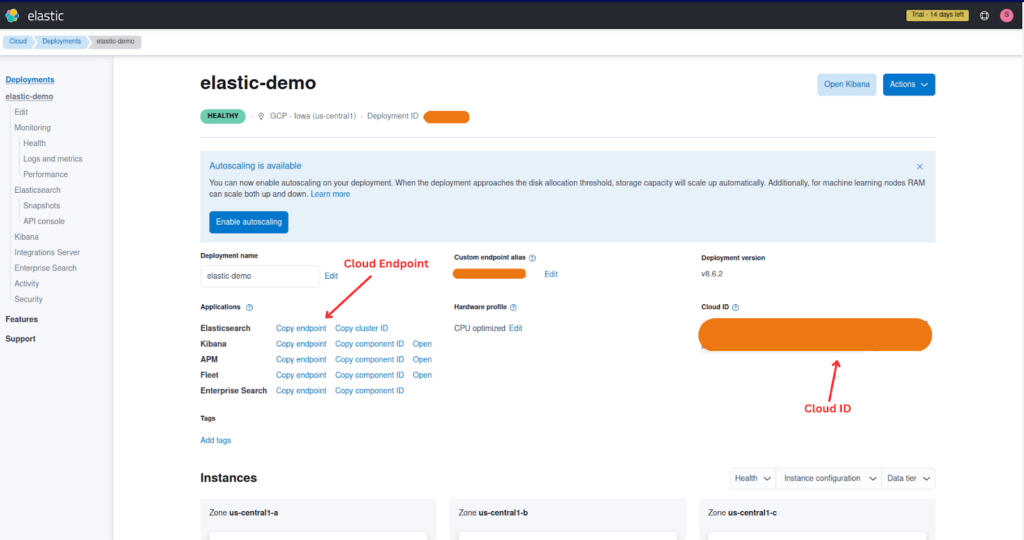
To set up your configuration, you will need to gather some information from your Elastic Cloud deployment. See the image below for how to locate it from the Elastic Cloud page.
HOST_NAME– Cloud ElasticSearch EndpointCLOUD_AUTH– These will have been provided to you when you created your Elasticsearch cluster. If you failed to make a note of them, you could reset the password.CLOUD_ID– The Cloud ID simplifies sending data to your cluster on Elastic Cloud.
Once you have gathered the required information, add the following to your fluent-bit.conf file below the filter section.
[OUTPUT]
	# optional: send the data to standard output for debugging
	Name stdout
	Match *

[OUTPUT]
	Name es
	Match *
	Host ELASTICSEARCH_ENDPOINT
	Cloud_auth USER_NAME:PASSWORD
	Cloud_id YOUR_CLOUD_ID_HERE
	Port 9243 # default port
	tls On
	tls.verify Off
	Suppress_Type_Name On
Tip: For more details about the Elasticsearch plugin parameters applied above check out the docs. For a more detailed guide check out our blog post on sending logs to Elasticsearch with Fluent Bit.
The Match * parameter indicates that all of the data gathered by Fluent Bit will be forwarded to Elastic Cloud instance. We could also match based on a tag defined in the input plugin. tls On ensures that the connection between Fluent Bit and the Elastic Cloud instance is secure. By default, the Port is configured to 9243.
Note: We have also defined a secondary output that sends all the data to stdout. This is not required for the Elastic Cloud configuration but can be incredibly helpful if we need to debug our configuration.
Create a sample log file
For the purposes of this tutorial, we will use a sample log file. Create a file named test.log with the following content.
2023-03-13 16:20:25.995  INFO 1 --- [       	main] o.h.e.t.j.p.i.JtaPlatformInitiator   	: HHH000490: Using JtaPlatform implementation: [org.hibernate.engine.transaction.jta.platform.internal.NoJtaPlatform]
2023-03-13 16:20:26.017  INFO 1 --- [       	main] j.LocalContainerEntityManagerFactoryBean : Initialized JPA EntityManagerFactory for persistence unit 'default'
Spring boot application running in IST timezone :Mon Mar 13 21:50:26 IST 2023
2023-03-13 16:20:26.294  INFO 1 --- [       	main] org.mongodb.driver.cluster           	: Cluster created with settings {hosts=[11.21.6.1:123], mode=SINGLE, requiredClusterType=UNKNOWN, serverSelectionTimeout='2000 ms'}
2023-03-13 16:20:28.187  WARN 1 --- [       	main] JpaBaseConfiguration$JpaWebConfiguration : spring.jpa.open-in-view is enabled by default. Therefore, database queries may be performed during view rendering. Explicitly configure spring.jpa.open-in-view to disable this warning
2023-03-13 16:20:28.948  INFO 1 --- [       	main] o.s.b.a.e.web.EndpointLinksResolver  	: Exposing 1 endpoint(s) beneath base path '/actuator'
2023-03-13 16:20:29.017  INFO 1 --- [       	main] o.s.b.w.embedded.tomcat.TomcatWebServer  : Tomcat started on port(s): 5000 (http) with context path ''
2023-03-13 16:20:29.040  INFO 1 --- [       	main] in.onecode.lms.LmsApplication        	: Started LmsApplication in 18.04 seconds (JVM running for 29.112)
2023-03-13 16:20:36.405  INFO 1 --- [.31.2.3214:12] org.mongodb.driver.cluster           	: Exception in monitor thread while connecting to server 172.3.6.1:27017

com.mongodb.MongoSocketOpenException: Exception opening socket
    at com.mongodb.internal.connection.SocketStream.open(SocketStream.java:70) ~[mongodb-driver-core-4.4.2.jar!/:na]
    at com.mongodb.internal.connection.InternalStreamConnection.open(InternalStreamConnection.java:180) ~[mongodb-driver-core-4.4.2.jar!/:na]
    at com.mongodb.internal.connection.DefaultServerMonitor$ServerMonitorRunnable.lookupServerDescription(DefaultServerMonitor.java:188) ~[mongodb-driver-core-4.4.2.jar!/:na]
    at com.mongodb.internal.connection.DefaultServerMonitor$ServerMonitorRunnable.run(DefaultServerMonitor.java:152) ~[mongodb-driver-core-4.4.2.jar!/:na]
    at java.lang.Thread.run(Thread.java:750) [na:1.8.0_362]
Caused by: java.net.SocketTimeoutException: connect timed out
    at java.net.PlainSocketImpl.socketConnect(Native Method) ~[na:1.8.0_362]
    at java.net.AbstractPlainSocketImpl.doConnect(AbstractPlainSocketImpl.java:350) ~[na:1.8.0_362]
    at java.net.AbstractPlainSocketImpl.connectToAddress(AbstractPlainSocketImpl.java:206) ~[na:1.8.0_362]
    at java.net.AbstractPlainSocketImpl.connect(AbstractPlainSocketImpl.java:188) ~[na:1.8.0_362]
    at java.net.SocksSocketImpl.connect(SocksSocketImpl.java:392) ~[na:1.8.0_362]
    at java.net.Socket.connect(Socket.java:607) ~[na:1.8.0_362]
    at com.mongodb.internal.connection.SocketStreamHelper.initialize(SocketStreamHelper.java:107) ~[mongodb-driver-core-4.4.2.jar!/:na]
    at com.mongodb.internal.connection.SocketStream.initializeSocket(SocketStream.java:79) ~[mongodb-driver-core-4.4.2.jar!/:na]
    at com.mongodb.internal.connection.SocketStream.open(SocketStream.java:65) ~[mongodb-driver-core-4.4.2.jar!/:na]
    ... 4 common frames omitted
2023-03-13 16:20:29.040  INFO 1 --- [       	main] in.onecode.lms.LmsApplication        	: Started LmsApplication in 18.04 seconds (JVM running for 29.112)
Start your Java logging pipeline
For ease of setup, I’ve written a docker-compose file to help you get started with all the necessary things, such as Fluent Bit and Java app log example configured to run locally. Create a file named docker-compose.yaml and add the following content:
version: "3"

volumes:
  log-data:
	driver: local
services:
  fluent-bit:
	image: fluent/fluent-bit
	volumes:
  	- ./fluent-bit.conf:/fluent-bit/etc/fluent-bit.conf
  	- ./parsers.conf:/fluent-bit/etc/parsers.conf
  	- ./log/:/etc/data
Put the fluent-bit.conf, docker-compose.yaml, and parsers.conf files in a directory, then within the same directory, create another directory named log and place the test.log file in there.
Your directory structure should look like this:
.
├── docker-compose.yaml
├── fluent-bit.conf
├── log
│   └── test.log
└── parsers.conf
Now, run the command below to get things up and running; make sure you’re running the terminal within the same directory as your docker-compose.yaml file and your Fluent Bit configuration files.
$ docker compose up --build
You should see output that resembles this:
[+] Running 2/2
 ⠿ Network fluent-bit-demo_default     	Created                                                                                                                          	0.1s
 ⠿ Container fluent-bit-demo-fluent-bit-1  Created                                                                                                                          	0.0s
Attaching to fluent-bit-demo-fluent-bit-1
fluent-bit-demo-fluent-bit-1  | Fluent Bit v2.0.9
fluent-bit-demo-fluent-bit-1  | * Copyright (C) 2015-2022 The Fluent Bit Authors
fluent-bit-demo-fluent-bit-1  | * Fluent Bit is a CNCF sub-project under the umbrella of Fluentd
fluent-bit-demo-fluent-bit-1  | * https://fluentbit.io
fluent-bit-demo-fluent-bit-1  |
fluent-bit-demo-fluent-bit-1  | [2023/03/20 07:48:29] [ info] [fluent bit] version=2.0.9, commit=4c0ca4fc5f, pid=1
fluent-bit-demo-fluent-bit-1  | [2023/03/20 07:48:29] [ info] [storage] ver=1.4.0, type=memory, sync=normal, checksum=off, max_chunks_up=128
fluent-bit-demo-fluent-bit-1  | [2023/03/20 07:48:29] [ info] [cmetrics] version=0.5.8
fluent-bit-demo-fluent-bit-1  | [2023/03/20 07:48:29] [ info] [ctraces ] version=0.2.7
fluent-bit-demo-fluent-bit-1  | [2023/03/20 07:48:29] [ info] [input:tail:tail.0] initializing
fluent-bit-demo-fluent-bit-1  | [2023/03/20 07:48:29] [ info] [input:tail:tail.0] storage_strategy='memory' (memory only)
fluent-bit-demo-fluent-bit-1  | [2023/03/20 07:48:29] [ info] [input:tail:tail.0] multiline core started
fluent-bit-demo-fluent-bit-1  | [2023/03/20 07:48:29] [ info] [output:stdout:stdout.0] worker #0 started
fluent-bit-demo-fluent-bit-1  | [2023/03/20 07:48:29] [ info] [sp] stream processor started
fluent-bit-demo-fluent-bit-1  | [2023/03/20 07:48:29] [ info] [output:es:es.1] worker #0 started
fluent-bit-demo-fluent-bit-1  | [2023/03/20 07:48:29] [ info] [output:es:es.1] worker #1 started
fluent-bit-demo-fluent-bit-1  | [2023/03/20 07:48:29] [ info] [input:tail:tail.0] inotify_fs_add(): inode=6815793 watch_fd=1 name=/etc/data/test.log
fluent-bit-demo-fluent-bit-1  | [0] etc.data.test.log: [1678724425.995000000, {"timestamp"=>"2023-03-13 16:20:25.995", "log_level"=>"INFO", "pid"=>"1", "thread_name"=>"main", "logger_name"=>"o.h.e.t.j.p.i.JtaPlatformInitiator", "message"=>"HHH000490: Using JtaPlatform implementation: [org.hibernate.engine.transaction.jta.platform.internal.NoJtaPlatform]"}]
fluent-bit-demo-fluent-bit-1  | [1] etc.data.test.log: [1678724426.017000000, {"timestamp"=>"2023-03-13 16:20:26.017", "log_level"=>"INFO", "pid"=>"1", "thread_name"=>"main", "logger_name"=>"j.LocalContainerEntityManagerFactoryBean", "message"=>"Initialized JPA EntityManagerFactory for persistence unit 'default'"}]
fluent-bit-demo-fluent-bit-1  | [2] etc.data.test.log: [1679298509.680409438, {"log"=>"Spring boot application running in IST timezone :Mon Mar 13 21:50:26 IST 2023
fluent-bit-demo-fluent-bit-1  | "}]
fluent-bit-demo-fluent-bit-1  | [3] etc.data.test.log: [1678724426.294000000, {"timestamp"=>"2023-03-13 16:20:26.294", "log_level"=>"INFO", "pid"=>"1", "thread_name"=>"main", "logger_name"=>"org.mongodb.driver.cluster", "message"=>"Cluster created with settings {hosts=[11.21.6.1:123], mode=SINGLE, requiredClusterType=UNKNOWN, serverSelectionTimeout='2000 ms'}"}]
fluent-bit-demo-fluent-bit-1  | [4] etc.data.test.log: [1678724428.187000000, {"timestamp"=>"2023-03-13 16:20:28.187", "log_level"=>"WARN", "pid"=>"1", "thread_name"=>"main", "logger_name"=>"JpaBaseConfiguration$JpaWebConfiguration", "message"=>"spring.jpa.open-in-view is enabled by default. Therefore, database queries may be performed during view rendering. Explicitly configure spring.jpa.open-in-view to disable this warning"}]
fluent-bit-demo-fluent-bit-1  | [5] etc.data.test.log: [1678724428.948000000, {"timestamp"=>"2023-03-13 16:20:28.948", "log_level"=>"INFO", "pid"=>"1", "thread_name"=>"main", "logger_name"=>"o.s.b.a.e.web.EndpointLinksResolver", "message"=>"Exposing 1 endpoint(s) beneath base path '/actuator'"}]
fluent-bit-demo-fluent-bit-1  | [6] etc.data.test.log: [1678724429.017000000, {"timestamp"=>"2023-03-13 16:20:29.017", "log_level"=>"INFO", "pid"=>"1", "thread_name"=>"main", "logger_name"=>"o.s.b.w.embedded.tomcat.TomcatWebServer", "message"=>"Tomcat started on port(s): 5000 (http) with context path ''"}]
fluent-bit-demo-fluent-bit-1  | [7] etc.data.test.log: [1678724429.040000000, {"timestamp"=>"2023-03-13 16:20:29.040", "log_level"=>"INFO", "pid"=>"1", "thread_name"=>"main", "logger_name"=>"in.onecode.lms.LmsApplication", "message"=>"Started LmsApplication in 18.04 seconds (JVM running for 29.112)"}]
fluent-bit-demo-fluent-bit-1  | [8] etc.data.test.log: [1678724436.405000000, {"timestamp"=>"2023-03-13 16:20:36.405", "log_level"=>"INFO", "pid"=>"1", "thread_name"=>".31.2.3214:12", "logger_name"=>"org.mongodb.driver.cluster", "message"=>"Exception in monitor thread while connecting to server 172.3.6.1:27017"}]
fluent-bit-demo-fluent-bit-1  | [9] etc.data.test.log: [1679298509.680436028, {"log"=>"com.mongodb.MongoSocketOpenException: Exception opening socket
fluent-bit-demo-fluent-bit-1  |     	at com.mongodb.internal.connection.SocketStream.open(SocketStream.java:70) ~[mongodb-driver-core-4.4.2.jar!/:na]
fluent-bit-demo-fluent-bit-1  |     	at com.mongodb.internal.connection.InternalStreamConnection.open(InternalStreamConnection.java:180) ~[mongodb-driver-core-4.4.2.jar!/:na]
fluent-bit-demo-fluent-bit-1  |     	at com.mongodb.internal.connection.DefaultServerMonitor$ServerMonitorRunnable.lookupServerDescription(DefaultServerMonitor.java:188) ~[mongodb-driver-core-4.4.2.jar!/:na]
fluent-bit-demo-fluent-bit-1  |     	at com.mongodb.internal.connection.DefaultServerMonitor$ServerMonitorRunnable.run(DefaultServerMonitor.java:152) ~[mongodb-driver-core-4.4.2.jar!/:na]
fluent-bit-demo-fluent-bit-1  |     	at java.lang.Thread.run(Thread.java:750) [na:1.8.0_362]
fluent-bit-demo-fluent-bit-1  | Caused by: java.net.SocketTimeoutException: connect timed out
fluent-bit-demo-fluent-bit-1  |     	at java.net.PlainSocketImpl.socketConnect(Native Method) ~[na:1.8.0_362]
fluent-bit-demo-fluent-bit-1  |     	at java.net.AbstractPlainSocketImpl.doConnect(AbstractPlainSocketImpl.java:350) ~[na:1.8.0_362]
fluent-bit-demo-fluent-bit-1  |     	at java.net.AbstractPlainSocketImpl.connectToAddress(AbstractPlainSocketImpl.java:206) ~[na:1.8.0_362]
fluent-bit-demo-fluent-bit-1  |     	at java.net.AbstractPlainSocketImpl.connect(AbstractPlainSocketImpl.java:188) ~[na:1.8.0_362]
fluent-bit-demo-fluent-bit-1  |     	at java.net.SocksSocketImpl.connect(SocksSocketImpl.java:392) ~[na:1.8.0_362]
fluent-bit-demo-fluent-bit-1  |     	at java.net.Socket.connect(Socket.java:607) ~[na:1.8.0_362]
fluent-bit-demo-fluent-bit-1  |     	at com.mongodb.internal.connection.SocketStreamHelper.initialize(SocketStreamHelper.java:107) ~[mongodb-driver-core-4.4.2.jar!/:na]
fluent-bit-demo-fluent-bit-1  |     	at com.mongodb.internal.connection.SocketStream.initializeSocket(SocketStream.java:79) ~[mongodb-driver-core-4.4.2.jar!/:na]
fluent-bit-demo-fluent-bit-1  |     	at com.mongodb.internal.connection.SocketStream.open(SocketStream.java:65) ~[mongodb-driver-core-4.4.2.jar!/:na]
fluent-bit-demo-fluent-bit-1  |     	... 4 common frames omitted
fluent-bit-demo-fluent-bit-1  | "}]
fluent-bit-demo-fluent-bit-1  | [10] etc.data.test.log: [1678724429.040000000, {"timestamp"=>"2023-03-13 16:20:29.040", "log_level"=>"INFO", "pid"=>"1", "thread_name"=>"main", "logger_name"=>"in.onecode.lms.LmsApplication", "message"=>"Started LmsApplication in 18.04 seconds (JVM running for 29.112)"}]
Verify the pipeline
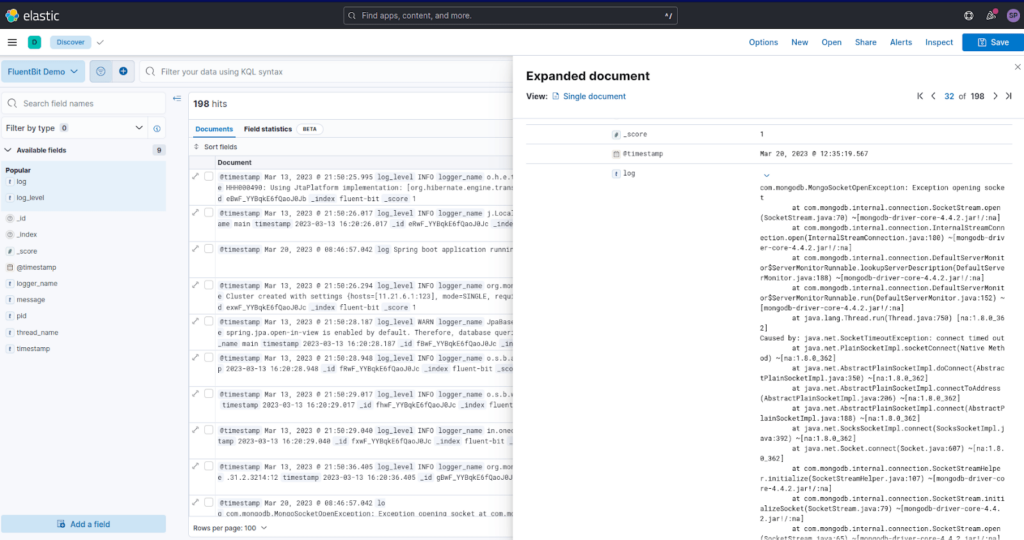
Once, all the services are up and running as defined in docker-compose, you can head over to your Elastic Cloud instance.
Check out the screenshot below, where logs are coming into Elastic Cloud. You can see we’re able to see the logs with structured data, and with the help of multiline parsing, stack traces are clearly visible as a whole.
Wrapping up and additional learning opportunities
In conclusion, configuring Fluent Bit to parse log messages correctly is crucial for ensuring accurate and complete log data is sent to Elasticsearch. By properly handling multiline log messages, Fluent Bit can avoid treating each line as a separate log entry and instead extract the desired structured data.
With Fluent Bit’s powerful parser plugin, it’s possible to extract structured data from log messages and store it in various data stores. This allows for more efficient analysis and querying of log data, making Fluent Bit an essential component of any logging pipeline.
To learn more about Fluent Bit, check out Fluent Bit Academy, your destination for best practices and how-to’s on advanced processing, routing, and all things Fluent Bit. Here’s a sample of what you can find there:
- Getting Started with Fluent Bit and OpenSearch
- Getting Started with Fluent Bit and OpenTelemetry
- Fluent Bit for Windows
Simplify your log pipeline management
Although Fluent Bit is a potent tool that can be easily configured manually, managing it can become challenging as your infrastructure scales up. Simplify your pipeline management with Chronosphere Telemetry Pipeline, from the creators of Fluent Bit and Calyptia.
Telemetry Pipeline provides support for all open standards and signals, including OpenTelemetry and Prometheus, and comes with out-of-the-box integrations that streamline log collection, aggregation, transformation, and routing from any source to any destination.
Whitepaper: Getting Started with Fluent Bit and OSS Telemetry Pipelines
Getting Started with Fluent Bit and OSS Telemetry Pipelines: Learn how to navigate the complexities of telemetry pipelines with Fluent Bit.


