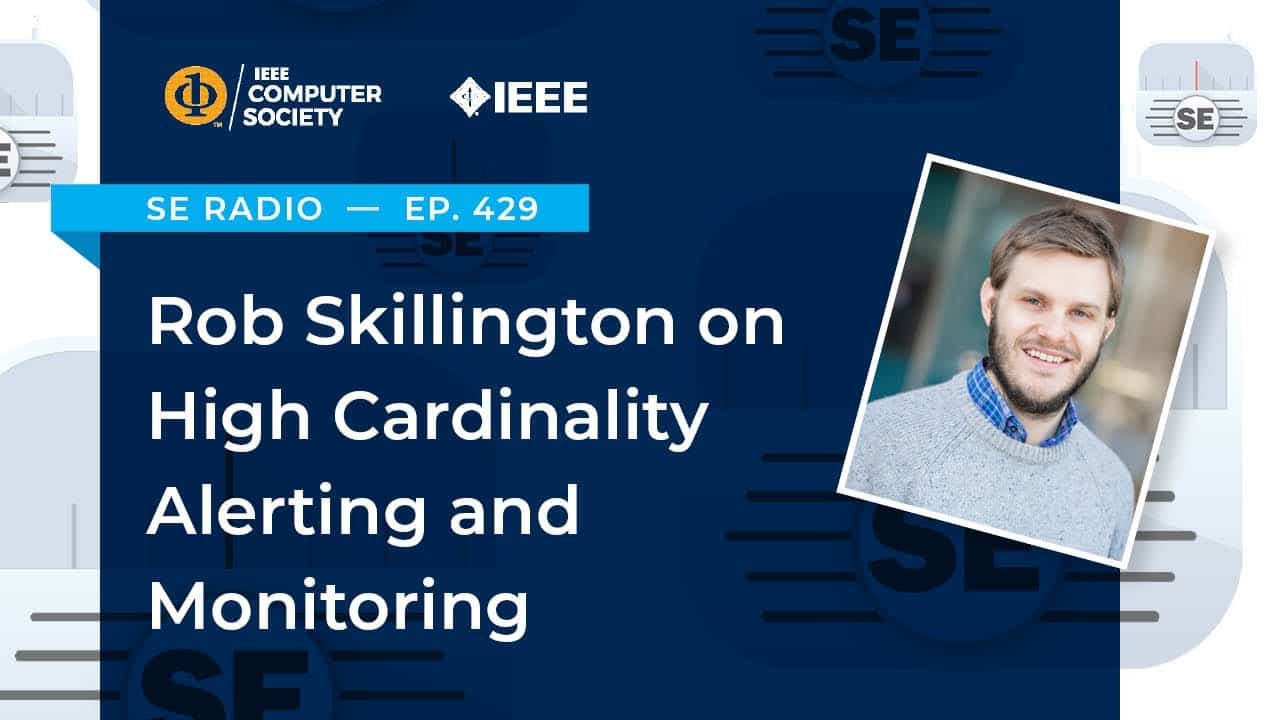
Earlier this year, Chronosphere’s CTO and co-founder, Rob Skillington, sat down with Software Engineering Radio’s Robert Blumen to discuss why high cardinality and high-dimension monitoring are needed for cloud-native environments where products (and engineering teams) are becoming complex and starting to scale.
After a quick run-through of the monitoring basics, the two drilled down on how things change at scale. We’ve highlighted a few moments from their conversation, and indicated where you can listen in to hear more of their technical discussion.
Defining monitoring and alerting at scale
RB: What does it mean to have monitoring and alerting at scale? Where are the challenges that start to emerge?
RS: At scale, what tends to happen is your system gets more complex, whether it’s your product getting more complex or because you’re scaling out the team. When it comes to monitoring these systems, you need to think about all the different things that can go wrong. I would start with really just defining your SLAs, asking:
- What are your service level agreements?
- What should the contracts be for the endpoints that are customer facing?
- When you break a contract, what will upset a customer, user, or your manager?
And then, once you have answered those questions, you then want to put alerts on those.
After you have solved monitoring the foundational things then you need to solve being able to understand the systems at a deeper level. At this point you can act and triage with highly contextual information about the system.
Listen in around 16:00 to catch more of their technical discussion around this topic, including Rob’s explanation about why complexity is getting harder – it’s because you’re tracking more things! “Fundamentally, you’re just adding dimensions to a lot of these metrics, whether it’s because you have a more complex product or because your infrastructure is more complex. And then it really comes down to, ‘How do you deal with that level of complexity and scale of the monitoring data?’”
High cardinality and high-dimension monitoring defined
RB: What do you mean by “high cardinality and high-dimension monitoring” and how does that relate to scale?
RS: As you scale up a complex system or an engineering team, it starts to look like a bowl of spaghetti from the outside. You can’t really see what’s going on. A lot of people start with reading the code, but at a certain level – even with three or four engineers or developers – you can reach a point where that’s inefficient. And when you’re encountering a failure in a system, the last thing you want to do is go read the code.
There may be something going wrong in your stack, but the alert you receive may not be giving you:
- Details about which version it’s running.
- Exactly which endpoint is impacted, in what region, and the sub-population of end users experiencing a problem.
- Where the problematic code is isolated to in terms of service, component, or datastore.
Listen in around 22:00 to hear more of their technical discussion around this topic, including Rob’s explanation, “You want to mitigate the problem first by orienting around what’s going wrong, using as much contextual information as possible. This is only possible with high-dimensional metrics, which is really about giving you those signals at higher and higher levels of granularity. This means when you do trigger an alert, it’s not just telling you that you’ve got a spike in error – it’s indicating:
- You’ve got a spike in error rate that is isolated to a subset of traffic that all share the same properties.
- There’s a specific HTTP endpoint that’s exhibiting the problem.
- It’s only happening with the new version of the code you rolled out in a single region for a subpopulation of the end users using a specific client application version.
300,000 time series: High cardinality by the numbers
RB: If we’re going to be talking about high cardinality, could you give us some orders of magnitude in an organization, like an Uber or a Netflix? What are we looking at for how many unique time series – how many distinct values – are there? Give us some concrete numbers.
RS: In one example, we may have five status codes that are important to you. And then, say, you’re monitoring 100 endpoints. And then, say, your product, or system, behaves differently, depending on where the user is – maybe you operate in 100 different markets or demographics. Then maybe you run your backend in 10 different cloud regions with 3 different active versions rolled out, depending on whether it’s a production environment or canary/staging environment. We’re talking about 300,000 time series. If you want to monitor anything else, like a user client agent – whether it’s Chrome or Safari, or whether it’s iOS or Android on mobile – that’s going to multiply by 300,000 again.
Listen in around 31:00 to catch more of their technical discussion around this topic, including Rob’s advice about how to use groupings to collapse dimensions, and when it makes sense to do that.
After dissecting today’s monitoring challenges, Rob and Robert rounded off their chat by discussing how Chronosophere’s observability solution is built for a high-cardinality world, and why it is the best solution for monitoring and alerting at scale.
Listen in on the entire discussion:


