

How to collect Java multi-line logs
Logging is a critical part of any application, especially in Java environments where exceptions and stack traces provide essential debugging information. However, when dealing with multiline logs—such as Java stack traces—traditional log collection tools often struggle to group related lines correctly. This can result in fragmented log entries that are hard to analyze or visualize.
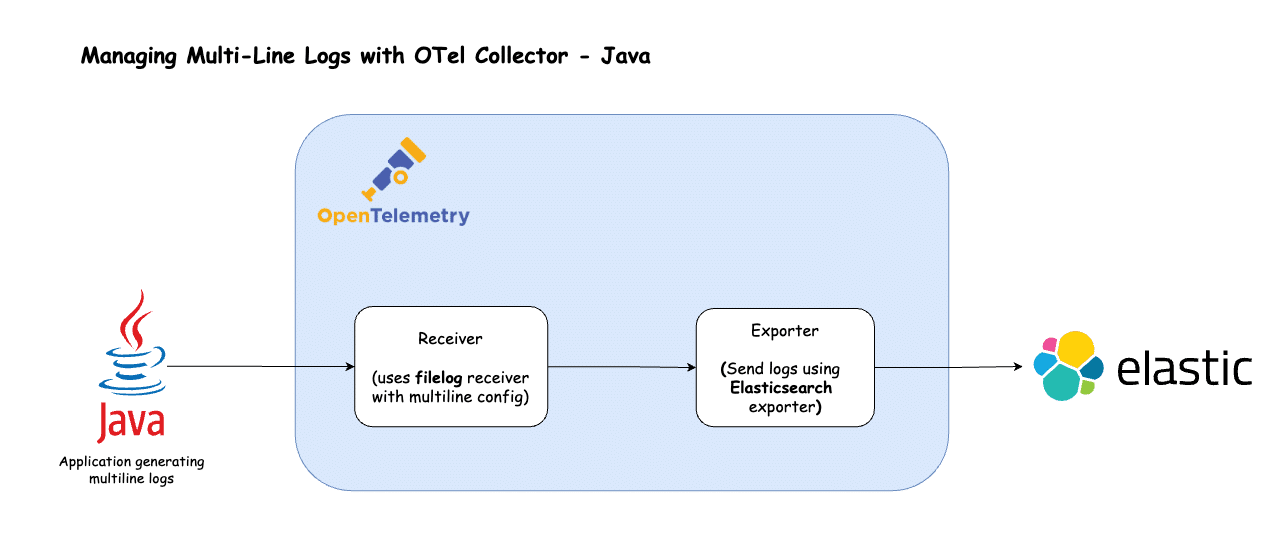
The OpenTelemetry (OTel) Collector offers a powerful solution for collecting, processing, and exporting logs, including multiline ones, to multiple destinations. In this blog, we’ll explore how to use the OTel Collector to manage Java multiline logs effectively and send them to Elasticsearch for analysis.
Prerequisites
- Docker: We will be running the OTel Collector in a Docker container. For installation, refer to this guide.
- Java: We will execute a Java program to generate multiline logs. For installation, refer to this guide.
- ElasticSearch: We will be sending logs to ElasticSearch. To follow along, refer to this guide.
- OTel Collector: Such as Receivers, Processors, Exporters, Connectors, and Pipelines. If you’re not familiar with these concepts, please refer to the official documentation.
Understanding the challenges with multi-line logs
Multiline parsing is critical for logs that contain detailed, multiline information—such as application errors or debugging outputs. Without proper parsing:
A stack trace might be split into multiple log entries, making it hard to analyze.
The context of the log could be lost, reducing its usefulness for monitoring and troubleshooting.
For example, consider the following log snippet:
Dec 14 06:41:08 INFO Starting application...

Exception in thread 1 "main" java.lang.NullPointerException

at com.example.myproject.Book.getTitle(Book.java:16)

at com.example.myproject.Author.getBookTitles(Author.java:25)

at com.example.myproject.Bootstrap.main(Bootstrap.java:14)
Java applications often produce logs that span multiple lines, especially when an exception occurs.
The first line is a standard log message, while the subsequent lines form a stack trace. The challenges with multiline logs include:
- Grouping Related Lines: Without proper configuration, log collectors might treat each line as a separate entry, breaking the stack trace into unusable fragments.
- Custom Separation: Depending on your needs, the stack trace should be a single entry (including all indented lines) or separate from the initial log message.
- Parsing Complexity: Logs can have varying formats, and identifying where one logical entry ends and another begins requires precise rules.
These challenges make it difficult to analyze logs effectively in monitoring tools like Elasticsearch, where a complete stack trace is often needed for troubleshooting. The OpenTelemetry Collector addresses these issues with its powerful receivers and processors, which we explore in the next section.
Buyer’s Guide: Telemetry Pipelines
Build a smarter telemetry pipeline. Download The Buyer’s Guide to Telemetry Pipelines
How multi-line parsing works with OpenTelemetry Collector
The filelog receiver is responsible for ingesting file-based logs into the OpenTelemetry Collector. To handle multiline logs, it provides a “multiline” configuration block where you can define rules for parsing logs that span multiple lines.
Here’s how it operates:
Pattern Specification: You specify a pattern that indicates either the start or end of a multiline log entry. For example:
- A common pattern might be the timestamp at the beginning of a log entry (e.g.,
^\\\\d{4}-\\\\d{2}-\\\\d{2}for a date like "2023-10-15"). - For a stack trace, you might use a pattern that matches the first line, such as
^Exceptionor^at\\\\s+.
Line Concatenation: Once the pattern is defined, the receiver concatenates all subsequent lines until it encounters the next occurrence of the pattern. The concatenated lines are then treated as a single log entry.
Example configuration
Here’s a sample configuration for the filelog receiver to handle multiline logs:
receivers:
  filelog:
    include: [ /var/log/myapp.log ]
    multiline:
      line_start_pattern: ^\\d{4}-\\d{2}-\\d{2} # Matches lines starting with a date
In this example, any log entry starting with a date (e.g., “2023-10-15”) marks the beginning of a new multiline log entry. All lines following it—until the next date is encountered—are combined into a single entry.
Advanced handling with operators
For more complex multiline log scenarios—where a simple start or end pattern isn’t sufficient—the OpenTelemetry Collector offers additional flexibility through Operators. One key operator for multiline parsing is the Recombine Operator.
Recombine Operator: This operator allows you to combine multiple log entries into one based on specific conditions. For instance:
- You can define a condition to merge lines that belong to the same event, even if they don’t follow a strict pattern.
- This is particularly useful for logs with irregular formats or varying multiline structures.
Example with recombine operator
Log message 1
Error: java.lang.Exception: Stack trace
        at java.lang.Thread.dumpStack(Thread.java:1336)
        at Main.demo3(Main.java:15)
        at Main.demo2(Main.java:12)
        at Main.demo1(Main.java:9)
        at Main.demo(Main.java:6)
        at Main.main(Main.java:3)
Another log message
The above example is for Java stack traces, the first line differs from the other lines in not starting with a whitespace. This can be expressed with the following configuration:
receivers:
  filelog:
    include: [ /var/log/myapp.log ]
    operators:
			- type: recombine
			  combine_field: body
			  is_first_entry: body matches "^[^\\s]"
To know more about the recombine operator, refer to this documentation.
In the next section, we will configure OpenTelemetry Collector with the filelog receiver to manage Java multiline logs.
Handling multi-Line with OpenTelemetry Collector
Let’s set up the OpenTelemetry Collector to manage multiline Java logs and export them to Elasticsearch.
Instructions for configuring Fluent Bit
1. Open your terminal and create a directory called,multi-line-log.
mkdir multi-line-log && cd multi-line-log
2. Create a file called MultiLineLogger.java with the below content
import java.util.logging.*;
import java.io.IOException;

public class MultiLineLogger {
    private static final Logger LOGGER = Logger.getLogger(MultiLineLogger.class.getName());

    // Configure logging at the start
    static {
        try {
            // Remove default console handler to avoid duplicate logs
            LOGGER.setUseParentHandlers(false);

            // File handler for multi_line.log
            FileHandler fileHandler = new FileHandler("multi_line.log", true); // true = append mode
            fileHandler.setFormatter(new SimpleFormatter()); // Use default SimpleFormatter
            LOGGER.addHandler(fileHandler);

            // Console handler
            ConsoleHandler consoleHandler = new ConsoleHandler();
            consoleHandler.setFormatter(new SimpleFormatter()); // Use default SimpleFormatter
            LOGGER.addHandler(consoleHandler);

            // Set logging level
            LOGGER.setLevel(Level.INFO);
        } catch (IOException e) {
            LOGGER.severe("Failed to configure logging: " + e.getMessage());
        }
    }

    // Array of messages with details
    private static final String[][] MESSAGES_WITH_DETAILS = {
            {"User login successful", "Username: johndoe\nIP: 192.168.1.10\nLocation: New York"},
            {"Database connection failed", "DB: PostgreSQL\nHost: db.example.com\nError: Timeout"},
            {"High memory usage detected", "Process: python_script.py\nUsage: 85%\nThreshold: 80%"},
            {"Processing data batch", "Batch ID: 12345\nRecords: 1000\nElapsed Time: 5.4s"}
    };

    // Function to generate errors with stack trace
    private static void generateErrors() {
        try {
            int result = 5 / 0; // Intentional ArithmeticException
        } catch (Exception e) {
            // Log the error with stack trace
            String stackTrace = getStackTraceAsString(e);
            LOGGER.severe("An error occurred:\n" + stackTrace);
        }
    }

    // Helper method to convert stack trace to string
    private static String getStackTraceAsString(Exception e) {
        StringBuilder sb = new StringBuilder();
        sb.append(e.toString()).append("\n");
        for (StackTraceElement element : e.getStackTrace()) {
            sb.append("    at ").append(element.toString()).append("\n");
        }
        return sb.toString();
    }

    // Main logic
    public static void main(String[] args) {
        // Loop 10 times
        for (int i = 0; i < 10; i++) {
            // Log each message with details
            for (String[] messageDetails : MESSAGES_WITH_DETAILS) {
                String message = messageDetails[0];
                String details = messageDetails[1];
                LOGGER.info(message + details);
            }

            // Generate stack trace error after one full iteration
            generateErrors();
        }
    }
}
3. Generate the logs by running the below command:
javac MultiLineLogger.java && java MultiLineLogger
This script will generate a mix of single and multiline logs and store them in a file multi_line.log
4. Create a file called config.yaml with the below content
receivers:
  filelog:
    include: ["/log/multi_line.log"]
    start_at: beginning
    multiline:
	    # Matches lines that start with a timestamp
	    # Lines that don't match this pattern (e.g., stack traces) will be appended to the previous log entry
      line_start_pattern: ^\d{4}-\d{2}-\d{2}\s+\d{2}:\d{2}:\d{2}

exporters:
  elasticsearch:
    endpoints: ["http://192.168.0.93:9200"]
    logs_index: "multi-line-log"
    user: "elastic"
    password: "uatVhRen"
    tls:
      insecure_skip_verify: true

service:
  pipelines:
    logs:
      receivers: [filelog]
      exporters: [elasticsearch]
Breaking down the configuration above, we define:
The receivers section defines how the OpenTelemetry Collector ingests log data. Here, a filelog receiver is configured with the following settings:
include: ["./multi_line.log"]
- Specifies that the collector will read log entries from a file named multi_line.log located in the /log/multi_line.log directory.
start_at: beginning
- Instruct the collector to begin reading the log file from the start when the collector launches. This ensures all existing log entries in the file are processed, not just new entries appended after startup.
multiline
-
- Enables the collector to handle multiline log entries, such as stack traces or logs that span multiple lines.
line_start_pattern: ^\\\\d{4}-\\\\d{2}\\\\d{2}\\\\s+\\\\d{2}:\\\\d{2}:\\\\d{2}- This regular expression defines the start of a new log entry by matching lines that begin with a timestamp in the format
YYYY-MM-DD HH:MM:SS(e.g.,2025-02-22 18:24:00). - Lines that don’t match this pattern (e.g., additional details or stack trace lines) are appended to the previous log entry, ensuring multiline logs are grouped correctly.
- This regular expression defines the start of a new log entry by matching lines that begin with a timestamp in the format
For more information on the filelog receiver, refer to this document.
The exporters section configures where the collected log data is sent. Here, an elasticsearch exporter is set up with these details:
endpoints: ["<http://192.168.0.93:9200>"]
- Specifies the Elasticsearch instance’s URL (http://192.168.0.93:9200) where logs will be exported.
logs_index: "multiline-log"
- Defines the Elasticsearch index name (multiline-log) where the logs will be stored.
user: "elastic" and password: "uatVhRen"
- Provides the credentials (
elastic:uatVhRen) for authenticating with the Elasticsearch instance.
tls: insecure_skip_verify: true
- Configures the collector to skip TLS certificate verification when connecting to Elasticsearch. This is useful for testing or with self-signed certificates but poses a security risk and is not recommended for production use.
Note: Based on your ElasticSearch deployment, you can change the host, port, HTTP_User, and HTTP_Passwd fields. For more information on the elasticsearch exporter, refer to this document.
The service section defines the data processing pipeline, connecting the receivers and exporters:
pipelines: logs
- Configures a single pipeline specifically for log data.
receivers: [filelog]
- Specifies that the
filelogreceiver is the source of log data for this pipeline.
exporters: [elasticsearch]
- Indicates that the
elasticsearchexporter is the destination for the log data.
This section ties the configuration together, creating a pipeline where logs from the filelog receiver are processed and forwarded to the elasticsearch exporter.
5. Run OTel Collector using the below command
docker run --rm \
--name otel-collector \
--network host \
-v $(pwd)/multi_line.log:/log/multi_line.log \
-v $(pwd)/config.yaml:/etc/otelcol-contrib/config.yaml \
-ti otel/opentelemetry-collector-contrib:0.120.0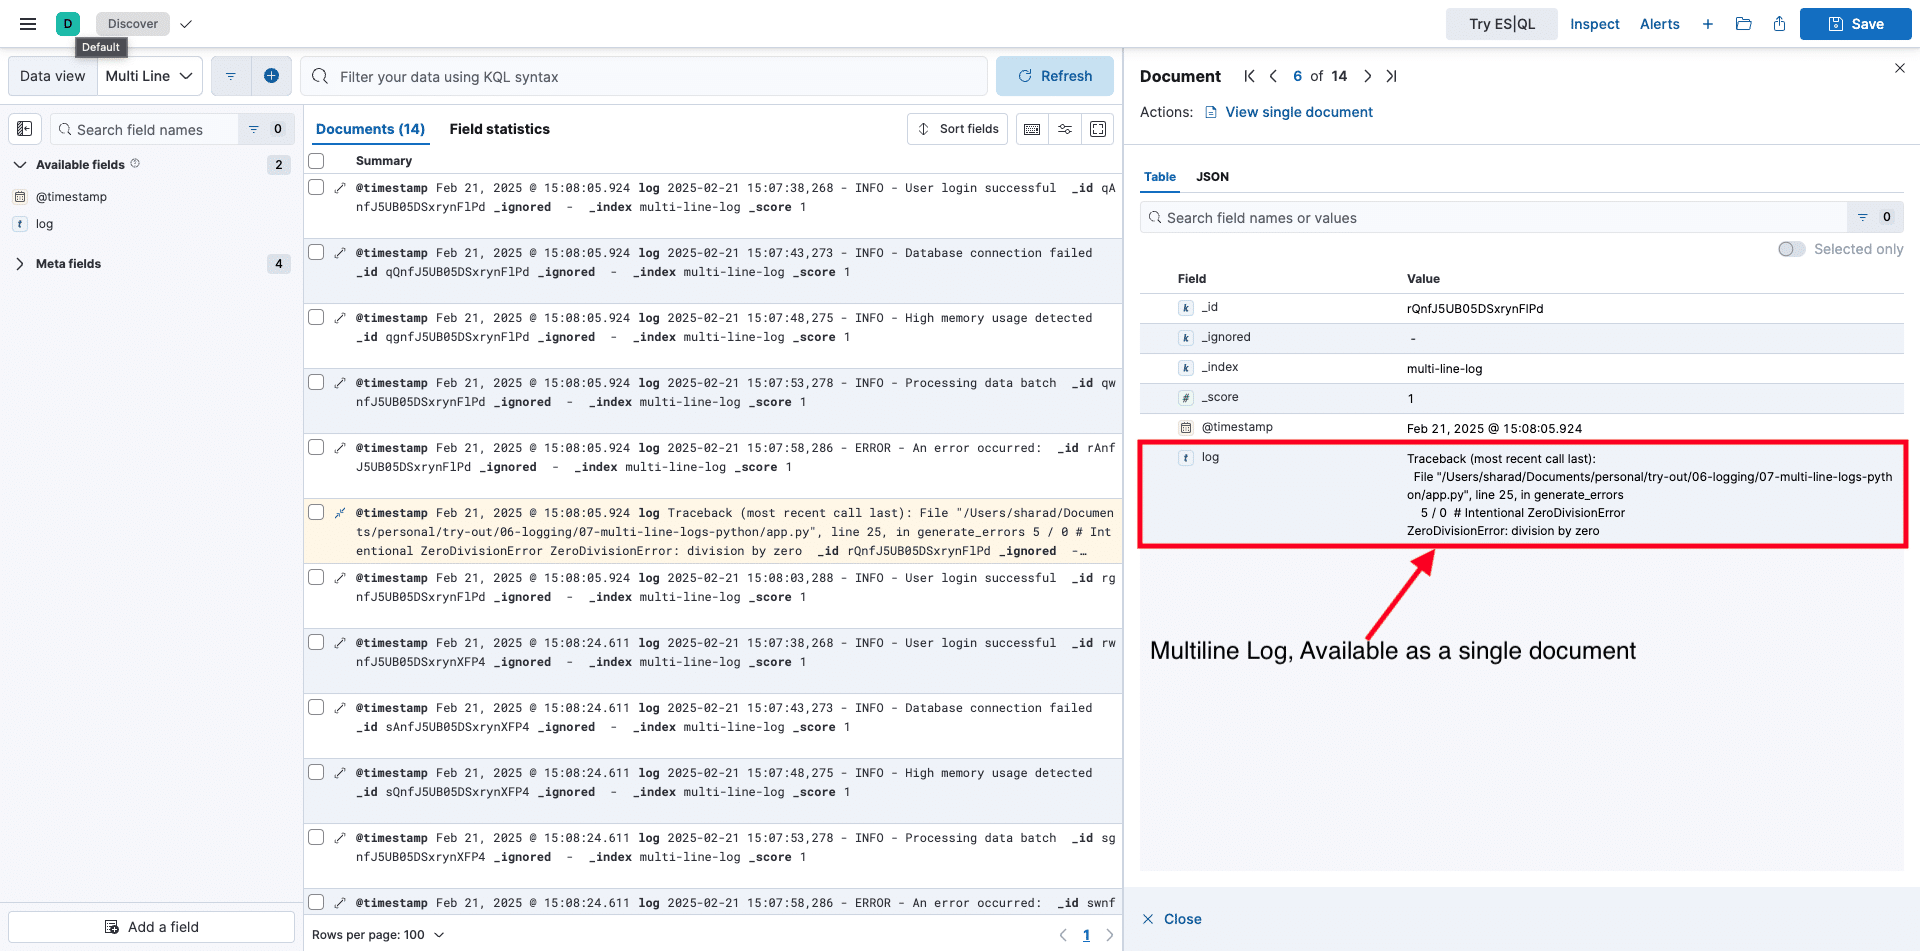
Conclusion
The OpenTelemetry Collector provides a robust solution for managing multiline logs, such as Java stack traces, by grouping related lines into single log entries. With its flexible configuration options, including pattern-based parsing with the filelog receiver and Recombine Operator, the OTel Collector can be tailored to handle complex log formats effectively.
This ensures that logs are properly formatted and exported to monitoring tools, enhancing debugging and monitoring capabilities. Although this blog post focuses on Java logs and Elasticsearch, the same principles can be applied to other programming languages and log management systems, showcasing the OTel Collector’s versatility.
Whitepaper: Getting Started with
Fluent Bit and OSS Telemetry Pipelines
Getting Started with Fluent Bit and OSS Telemetry Pipelines: Learn how to navigate the complexities of telemetry pipelines with Fluent Bit.


