

Get multi-line logs under control
Have you ever found yourself staring at your application logs, trying to interpret a stack trace or a custom log format spread across multiple lines? It’s frustrating, isn’t it? You’re filtering through error messages and timestamps, but piecing them together feels like solving a puzzle with missing pieces. Getting multi-line logs under control is essential for accurate analysis and resolving issues.
In this guide, we’ll explore:
- How to manage those multi-line logs using Fluent Bit’s built-in parsers
- How to create custom parsers for more complex scenarios
- How to configure Fluent Bit to consolidate logs properly and ensure your log data is meaningful and actionable
If you are new to multiline parsing, refer to our introductory blog on managing multi-line logs: Managing multi-line logs with Fluent Bit and Python.
receivers:
  filelog:
    include: [ /var/log/myapp.log ]
    multiline:
      line_start_pattern: ^\\d{4}-\\d{2}-\\d{2} # Matches lines starting with a date
Prerequisites
- Docker: We will be running Fluent Bit in a Docker container. For installation, refer to this guide.
- Python: We will execute a Python script to generate multiline logs. For installation, refer to this guide.
- ElasticSearch: We will be sending logs to ElasticSearch. To follow along, refer to this guide.
- Familiarity with Fluent Bit concepts: Such as inputs, outputs, parsers, and filters. If you’re not familiar with these concepts, please refer to the official documentation.

Instructions for configuring Fluent Bit
1. Open your terminal and create a directory called Fluent Bit multi-line-log.
mkdir multi-line-log && cd multi-line-log2. Create a file called app.py with the below content
import logging
import traceback

# Configure logging
logging.basicConfig(
    level=logging.INFO,
    format="%(asctime)s - %(levelname)s - %(message)s",
    handlers=[
        logging.FileHandler("multi_line.log"),
        logging.StreamHandler()
    ]
)

messages = [
    "User login successful",
    "Database connection failed",
    "High memory usage detected",
    "Processing data batch"
]

def generate_errors():
    """Function that generates a stack trace and logs it."""
    try:
        5 / 0  # Intentional ZeroDivisionError
    except Exception:
        logging.error("An error occurred:\\n" + traceback.format_exc())  # Log stack trace

def main():
    """Main function to log messages 10 times and generate errors."""
    for _ in range(10):  # Loop 10 times
        for message in messages:
            logging.info(message)

        # Generate stack trace error after one full iteration
        generate_errors()

if __name__ == "__main__":
    main()
3. Generate the logs by running the below command:
python3 app.pyThis script will generate a mix of single and multiline logs and store them in a file multi_line.log
4. Create a file called fluent-bit.conf with the below content
[INPUT]
    Name        tail
    Path        /log/multi_line.log
    Tag         my_logs
    Read_from_Head True
    multiline.parser python

[OUTPUT]
    Name  es
    Match *
    Host  192.168.0.213
    Port  9200
    Index multi-line-log
    HTTP_User elastic
    HTTP_Passwd uatVhRen
    Suppress_Type_Name On
Breaking down the configuration above, we define one input section:
Tail: This input section captures logs from the start of the multi_line.log file and tags them as my_logs. It also applies the built-in python multiline parser to merge multiline logs into a single entry while reading. For more information on the tail plugin, refer to this doc.
Next in the pipeline is the output section:
Elasticsearch: This section matches all the logs generated by the input plugins and sends them to Elasticsearch. It will create an index called multi-line-log in Elasticsearch.
Note: Based on your Elasticsearch deployment, you can change the host, port, HTTP_User, and HTTP_Passwd fields. For more information on the es plugin, refer to this doc.
5. Run Fluent Bit using the below command
docker run --rm \
--name fluent-bit -p 3000:3000 \
-v $(pwd)/multi_line.log:/log/multi_line.log   \
-v $(pwd)/fluent-bit.conf:/fluent-bit/etc/fluent-bit.conf   \
-ti cr.fluentbit.io/fluent/fluent-bit:3.2   /fluent-bit/bin/fluent-bit   -c /fluent-bit/etc/fluent-bit.conf
6. Observe the output in Kibana
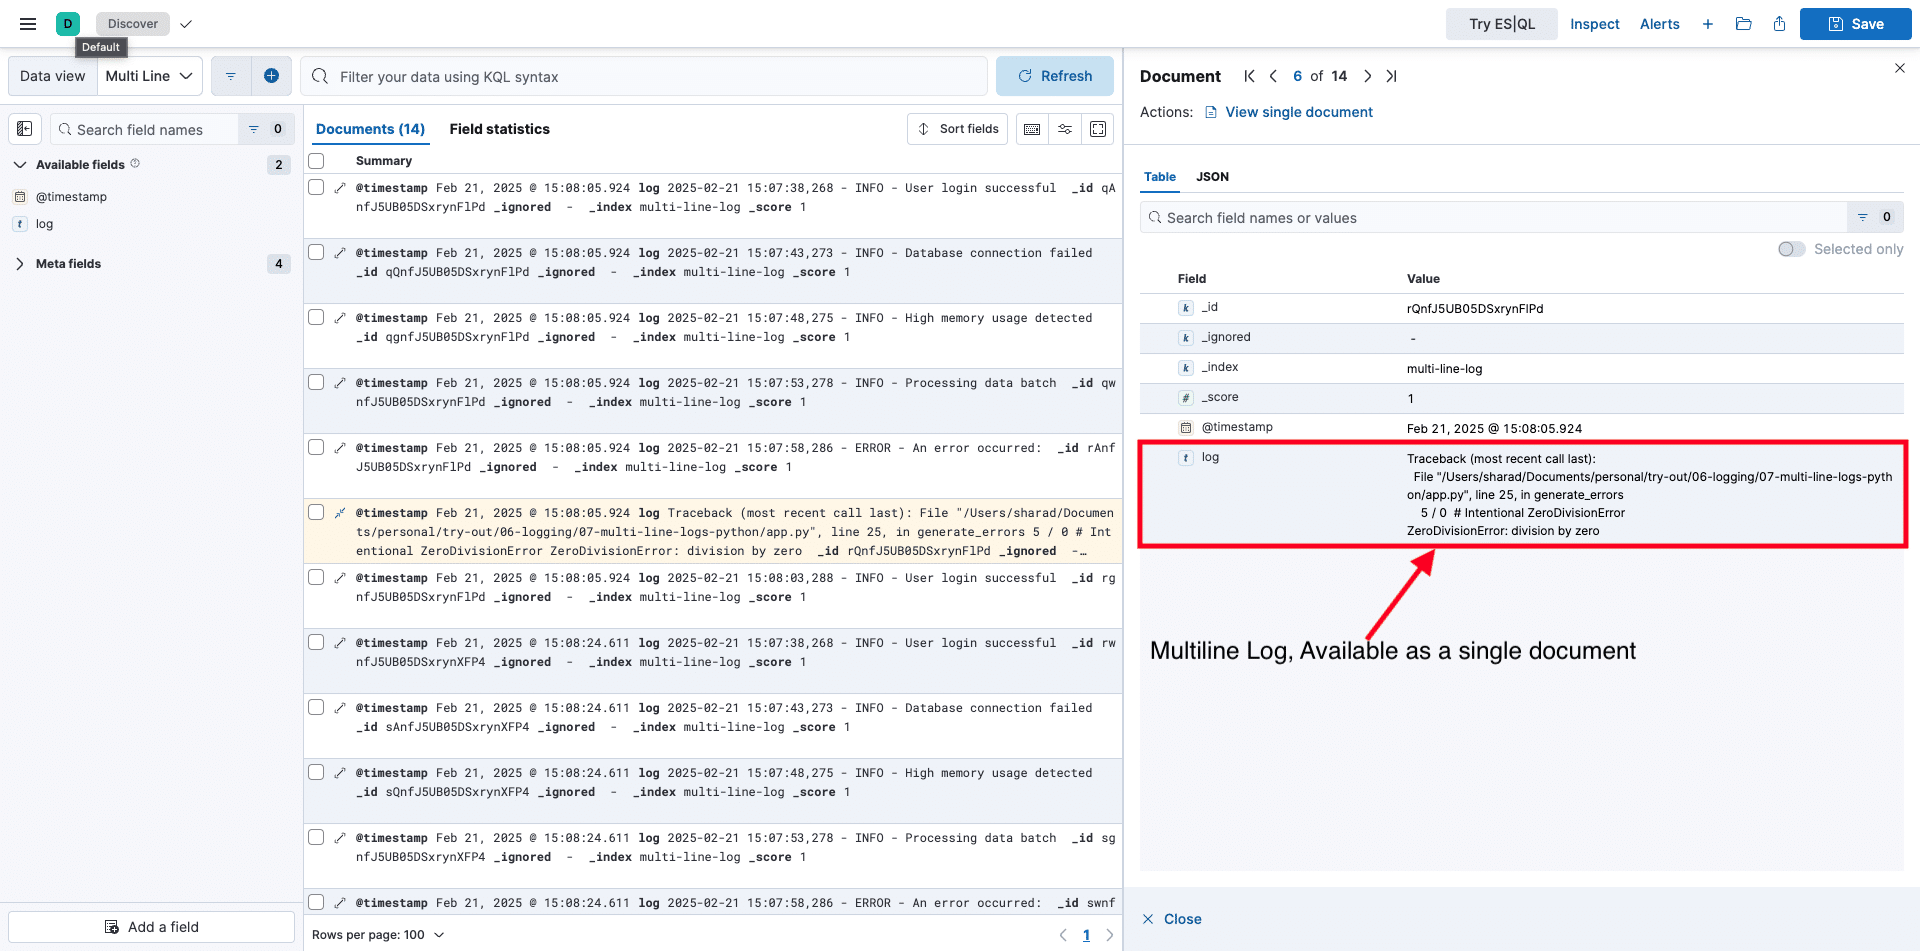
Note: To view logs in the UI, you have to create a Data View in Kibana and select a multi-line-log index. To learn how to create, refer to this guide.
7. After verifying the logs, Press ctlr + c to close the FluentBit container.
Limitations of the built-in Python multi-line parser
The built-in multiline parser for Python logs is a preconfigured custom parser crafted by the Fluent Bit team. This parser works well for specific Python log formats—single-line logs or exceptions. However, it struggles with custom application logs with unique multiline patterns.
Consider the following log example:
2025-02-21 17:38:12,381 - INFO - User login successful
2025-02-21 17:38:12,381 - INFO - Database connection failed
DB: PostgreSQL
Host: db.example.com
Error: Timeout
2025-02-21 17:38:12,381 - ERROR - An error occurred:
Traceback (most recent call last):
  File "/Users/sharad/Documents/personal/try-out/06-logging/07-multi-line-logs-python/custom_app.py", line 24, in generate_errors
    5 / 0  # Intentional ZeroDivisionError
ZeroDivisionError: division by zero
For custom multi-line logs beyond basic exceptions, the built-in parser falls short. This is where a custom multi-line parser becomes essential. In the next section, we’ll see how to create a custom multi-line parser to handle these scenarios effectively.
Buyer’s Guide: Telemetry Pipelines
Build a smarter telemetry pipeline. Download The Buyer’s Guide to Telemetry Pipelines
Handling multi-line with custom parsers
1. Open your terminal and create a directory called multi-line-log-custom.
mkdir multi-line-log-custom && cd multi-line-log-custom2. Create a file called app.py with the below content.
import logging
import traceback

# Configure logging
logging.basicConfig(
    level=logging.INFO,
    format="%(asctime)s - %(levelname)s - %(message)s",
    handlers=[
        logging.FileHandler("multi_line.log"),
        logging.StreamHandler()
    ]
)

messages_with_details = [
    ("User login successful", "Username: johndoe\\nIP: 192.168.1.10\\nLocation: New York"),
    ("Database connection failed", "DB: PostgreSQL\\nHost: db.example.com\\nError: Timeout"),
    ("High memory usage detected", "Process: python_script.py\\nUsage: 85%\\nThreshold: 80%"),
    ("Processing data batch", "Batch ID: 12345\\nRecords: 1000\\nElapsed Time: 5.4s")
]

def generate_errors():
    """Function that generates a stack trace and logs it."""
    try:
        5 / 0  # Intentional ZeroDivisionError
    except Exception:
        logging.error("An error occurred:\\n" + traceback.format_exc())  # Log stack trace

def main():
    """Main function to log messages 10 times and generate errors."""
    for _ in range(10):  # Loop 10 times
        for message, details in messages_with_details:
            logging.info(f"{message}\\n{details}")

        # Generate stack trace error after one full iteration
        generate_errors()

if __name__ == "__main__":
    main()
3.Generate the logs by running the below command:
python3 app.pyThis script will generate a mix of single and multiline logs and store them in a file multi_line.log
4. Create a file called parsers_multiline.conf with the below content.
[MULTILINE_PARSER]
    name          python-multiline-regex-test
    type          regex
    flush_timeout 1000
    rule          "start_state"   "^\\d{4}-\\d{2}-\\d{2}\\s+\\d{2}:\\d{2}:\\d{2},\\d{3}\\s+-\\s+[A-Z]+\\s+-\\s+.+"  "cont"
    rule          "cont"          "^(?!^\\d{4}-\\d{2}-\\d{2}\\s+\\d{2}).+"                            "cont"
name: python-multiline-regex-test
- This is a unique identifier for the parser. You’d reference it in an input plugin (like tail) or a multiline filter with multiline.parser = python-multiline-regex-test.
type: regex
- Specifies that this parser uses regular expressions to define its matching rules, as opposed to predefined formats like java or python.
- rule “start_state” “^\\\\d{4}-\\\\d{2}-\\\\d{2}\\\\s+\\\\d{2}:\\\\d{2}:\\\\d{2},\\\\d{3}\\\\s+-\\\\s+[A-Z]+\\\\s+-\\\\s+.+” “cont”
- This is the rule for identifying the start of a new log entry. Let’s break down the regex:
- ^ – Start of the line.
- \\\\d{4}-\\\\d{2}-\\\\d{2} – Matches a date like 2025-02-21.
- \\\\s+ – One or more whitespace characters.
- \\\\d{2}:\\\\d{2}:\\\\d{2},\\\\d{3} – Matches a time with milliseconds, e.g., 17:38:12,381.
- \\\\s+-\\\\s+ – Matches the separator (spaces and a hyphen) between timestamp and log level.
- [A-Z]+ – Matches the log level in uppercase, like INFO, ERROR, or DEBUG.
- \\\\s+-\\\\s+ – Matches the separator after the log level.
- .+ – Captures the rest of the line (the log message), ensuring it’s not empty.
- Behavior: When a line matches this pattern, Fluent Bit starts a new log record and transitions to the cont state to look for continuation lines. This rule catches typical Python log entries like 2025-02-21 17:38:12,381 – ERROR – An error occurred:.
- rule “cont” “^(?!^\\\\d{4}-\\\\d{2}-\\\\d{2}\\\\s+\\\\d{2}).+” “cont”
- This rule handles continuation lines—lines that belong to the same log entry but don’t start a new one. Here’s the regex breakdown:
- ^ – Start of the line.
- (?!^\\\\d{4}-\\\\d{2}-\\\\d{2}\\\\s+\\\\d{2}) – A negative lookahead ensuring the line doesn’t begin with a new timestamp (e.g., 2025-02-21 17:). This distinguishes continuation lines from new log entries.
- .+ – Matches the rest of the line, capturing any content.
- Behavior: If a line doesn’t start with a timestamp, it’s appended to the current record, and Fluent Bit stays in the cont state to keep collecting more lines. This captures stack traces (e.g., Traceback (most recent call last):), exception details (e.g., ZeroDivisionError: division by zero), or custom lines (e.g., DB: PostgreSQL)
5. Create a file called fluent-bit.conf with the below content.
[SERVICE]
    flush                 1
    log_level             info
    parsers_file          parsers_multiline.conf

[INPUT]
    Name        tail
    Path        /log/multi_line.log
    Tag         my_logs
    Read_from_Head True
    multiline.parser python-multiline-regex-test

[OUTPUT]
    Name  es
    Match *
    Host  192.168.0.213
    Port  9200
    Index multi-line-log
    HTTP_User elastic
    HTTP_Passwd uatVhRen
    Suppress_Type_Name On
This is similar to the previous configuration, the only difference being registering the parsers_multiline.conf file, which contains the definition for our custom parser.
6. Run FluentBit using the below command.
docker run --rm \
--name fluent-bit -p 3000:3000 \
-v $(pwd)/multi_line.log:/log/multi_line.log \
-v $(pwd)/parsers_multiline.conf:/fluent-bit/etc/parsers_multiline.conf \
-v $(pwd)/fluent-bit.conf:/fluent-bit/etc/fluent-bit.conf \
-ti cr.fluentbit.io/fluent/fluent-bit:3.2 /fluent-bit/bin/fluent-bit -c /fluent-bit/etc/fluent-bit.conf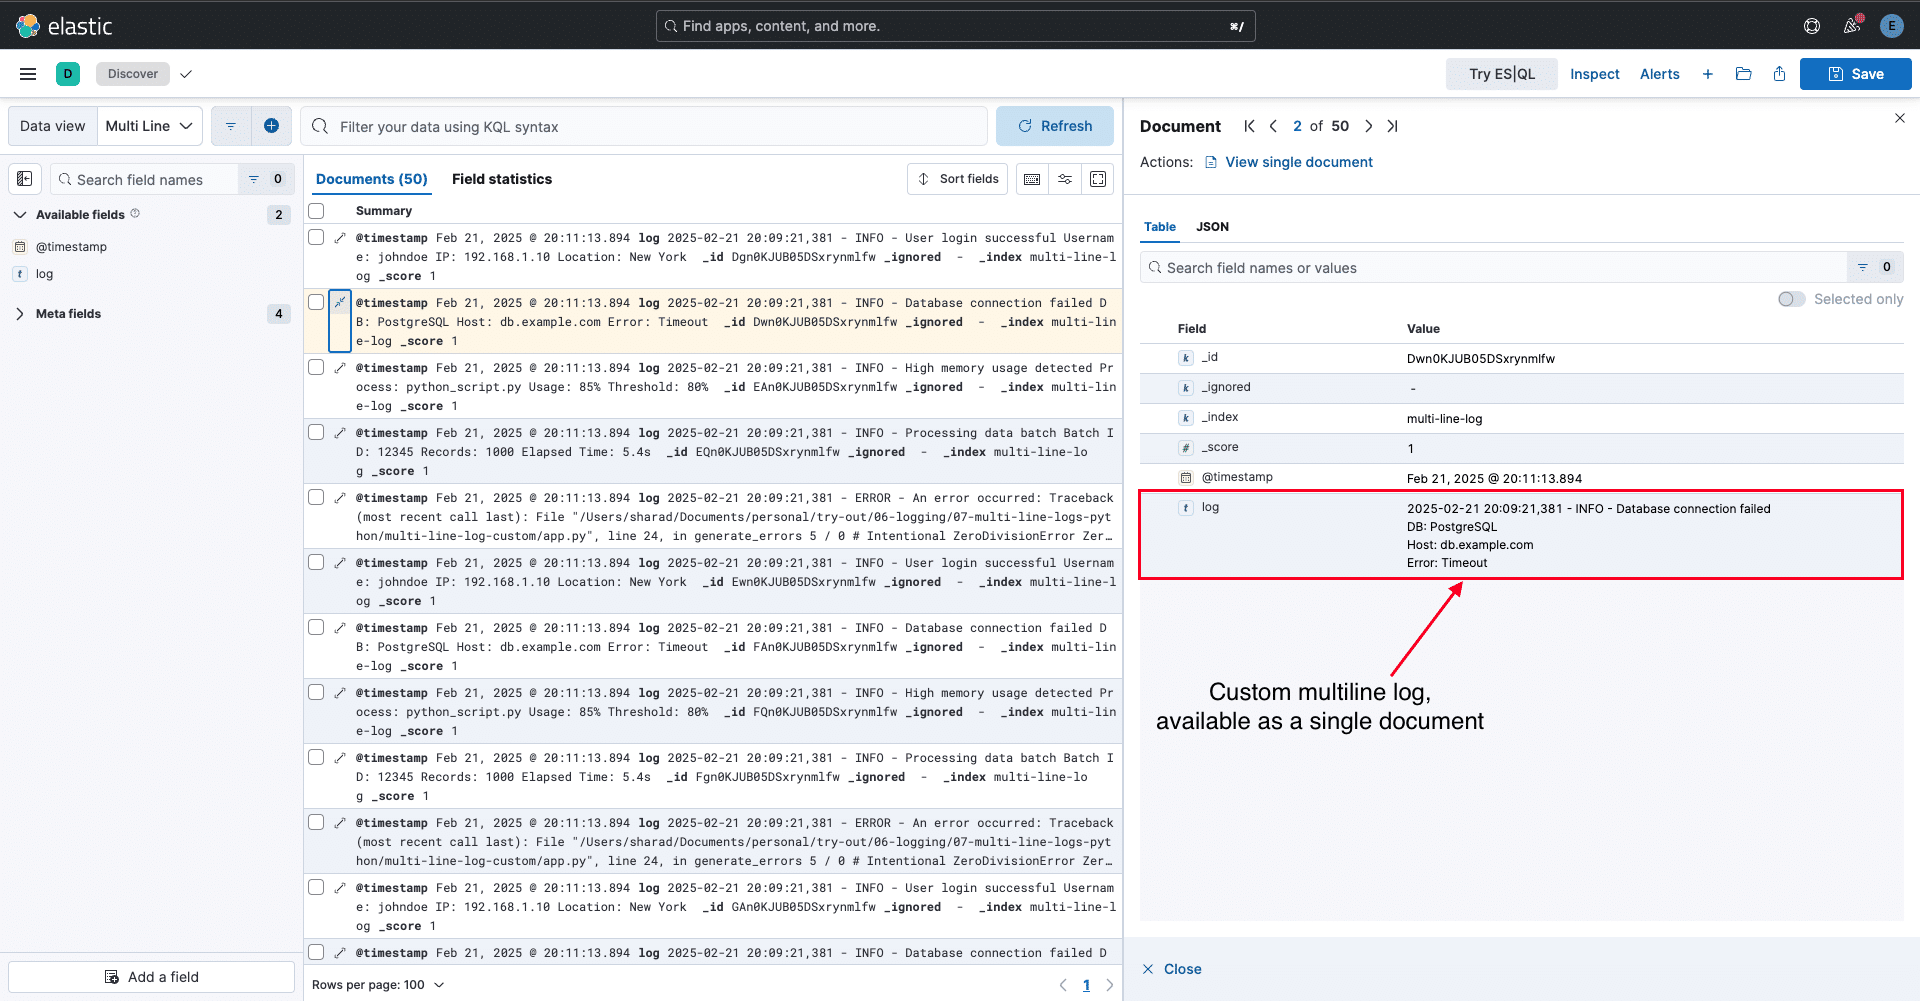 Note: To view logs in the UI, you have to create a Data View in Kibana and select multi-line-log index. To learn how to create, refer to this guide
Conclusion
Multi-line logs, like Python stack traces and custom application outputs, require careful handling to maintain their context and usefulness. Fluent Bit simplifies this with built-in and custom multi-line parsers, offering flexibility at both input and filter stages. While built-in parsers handle basic cases, custom parsers empower you to tackle complex log patterns effectively. This guide demonstrated how to configure Fluent Bit to consolidate multiline logs.
Read the previous blog in this two-part series: Managing multi-line logs with Fluent Bit and Python.
Whitepaper: Getting Started with Fluent Bit and OSS Telemetry Pipelines
Getting Started with Fluent Bit and OSS Telemetry Pipelines: Learn how to navigate the complexities of telemetry pipelines with Fluent Bit.

