Introduction
Fluent Bit is a super fast, lightweight, and scalable telemetry data agent and processor for logs, metrics, and traces. With over 15 billion Docker pulls, Fluent Bit has established itself as a preferred choice for log processing, collecting, and shipping.
In this post, we’ll discuss common logging challenges and then explore how Fluent Bit’s parsing capabilities can effectively address them.
A Fluent Bit community member has created a video on this topic, If you prefer video format, you can watch it here.
How Fluent Bit Parsing Provides Clarity
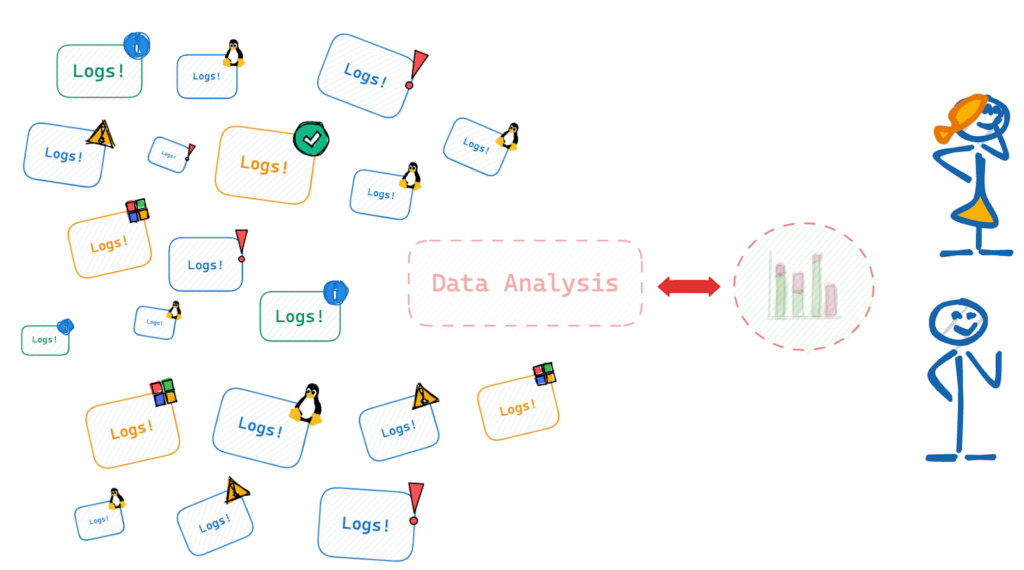
In software development logs are invaluable. The primary objective of collecting logs is to enable data analysis that drives both technical and business decisions. Logs provide insights into system behavior, user interactions, and potential issues. However, the path from raw log data to actionable insights comes with challenges. Let’s explore these challenges and understand why parsing is a critical step in the logging pipeline.
Raw log data is often unstructured and difficult for humans and machines to interpret efficiently. Consider this Apache HTTP Server log entry:
66.249.65.129 -- [12/Sep/2024/:19:10:38 +0600] "GET /news/index.html HTTP/1.1" 200 177 "-" "Mozilla/5.0While an engineer might decipher this, it’s not helpful for end-users or automated analysis tools. Ideally, we want to transform this into a structured format like JSON:
{
    "ip_address": "66.249.65.129",
    "request_time": "12/Sep/2024/:19:10:38 +0600",
    "http_method": "GET",
    "request_uri": "/news/index.html",
    "http_version": 1.1,
    "http_code": 200,
    "content_size": 177,
    "user_agent": "Mozilla/5.0"
}
This structured format makes it easier to search, analyze, and visualize the data.
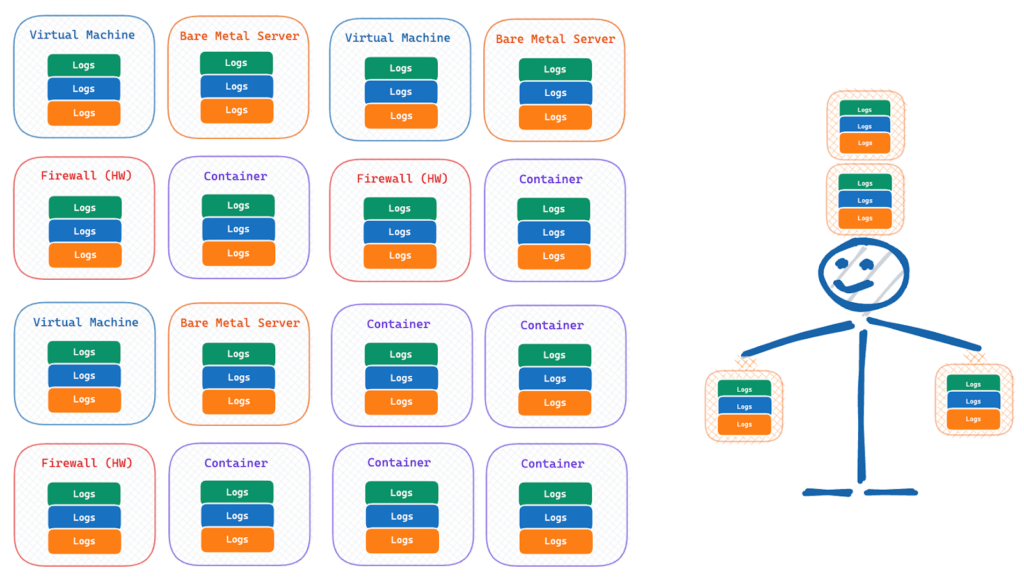
Modern IT environments are complex, with logs coming from various sources, including:
- Application logs
- Web server logs (e.g., Apache, Nginx)
- System logs (e.g., syslog)
- Operating system logs (Linux, Windows)
- Container logs
- Cloud service logs
Each of these sources might log data in different locations:
- File systems (e.g., /var/log*, /dev/kmsg)
- Local API services (e.g., libsystemd, Windows Event Logs API)
- Network endpoints (e.g., Syslog receiver TCP/TLS, HTTP receiver)
With multiple data sources comes the challenge of dealing with diverse log formats. Some common formats include:
- Apache Common Log Format
- Nginx access logs
- JSON logs
- Syslog
- Custom application-specific formats
To extract value from these logs, we need to standardize and parse it into a consistent format.
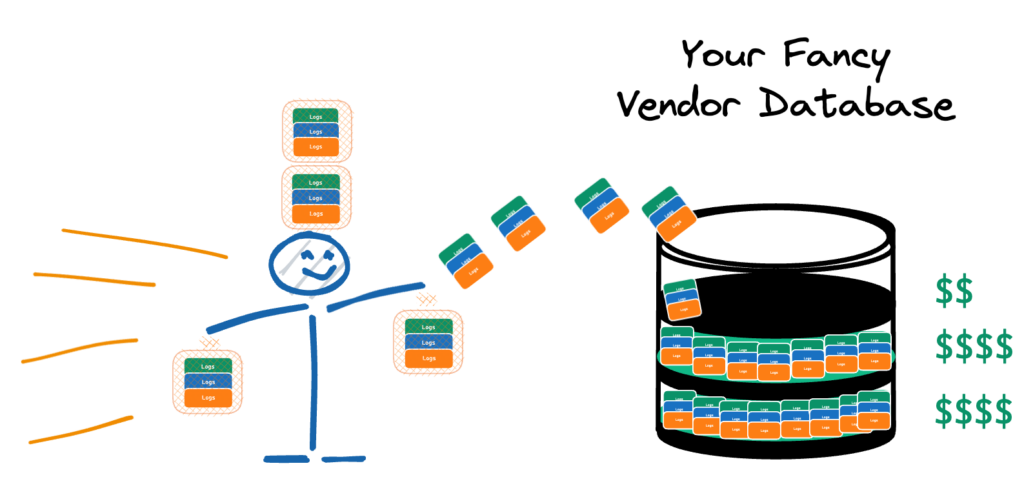
Given the sheer volume of log data generated in modern systems, it’s tempting to push everything directly into a centralized database for processing. However, this approach has drawbacks:
- Scalability Issues: Processing vast amounts of raw log data at the destination can overwhelm your systems.
- Cost Concerns: Many log management vendors charge based on data ingestion and storage. Sending unprocessed logs can significantly increase costs.
- Noise Reduction: Not all log data is equally valuable. Processing logs at the source allows you to filter out unnecessary information.
The Solution: Parsing with Fluent Bit
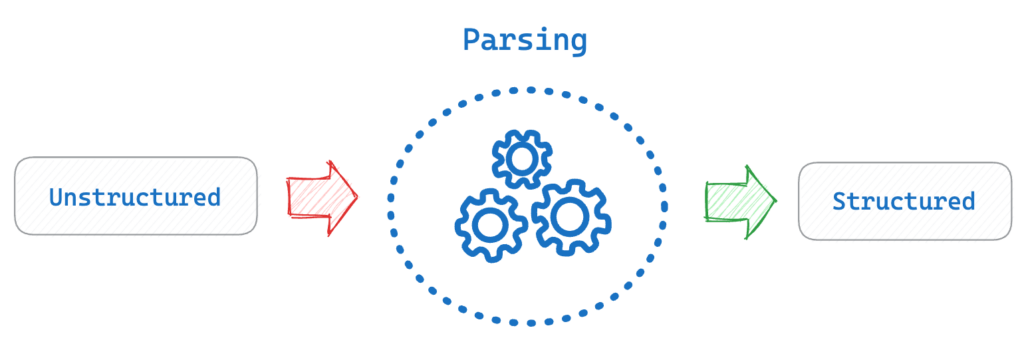
This is where Fluent Bit’s parsing capabilities come into play. Parsing transforms unstructured log lines into structured data formats like JSON. By implementing parsing as part of your log collection process, you can:
- Standardize logs from diverse sources
- Extract only the relevant information
- Reduce data volume and associated costs
- Prepare data for efficient analysis and visualization
In the following sections, we’ll dive deeper into how Fluent Bit helps you overcome these challenges through its parsing capabilities.
Getting Started with the Fluent Bit Parser
Built In Parsers
Fluent Bit has many built-in parsers for common log formats like Apache, Nginx, Docker and Syslog. These parsers are pre-configured and ready to use, making it easier to get started with log processing. To use a built-in parser:
- Configure an input source (e.g. tail plugin to read log files)
- Add the parser to your Fluent Bit config
- Apply the parser to your input
Here’s an example of parsing Apache logs:
pipeline:
  inputs:
    - name: tail
      path: /input/input.log
      refresh_interval: 1
      parser: apache
      read_from_head: true

  outputs:
    - name: stdout
      match: '*'
This configuration will parse Apache log lines into structured fields. For instance the below Apache logs.
192.168.2.20 - - [29/Jul/2015:10:27:10 -0300] "GET /cgi-bin/try/ HTTP/1.0" 200 3395
192.168.2.20 - - [29/Jul/2015:10:27:10 -0300] "GET /cgi-bin/try/ HTTP/1.0" 200 3395
192.168.2.20 - - [29/Jul/2015:10:27:10 -0300] "GET /cgi-bin/try/ HTTP/1.0" 200 3395
Fluent bit will generate the below output.
[0] tail.0: [[1438176430.000000000, {}], {"host"=>"192.168.2.20", "user"=>"-", "method"=>"GET", "path"=>"/cgi-bin/try/", "code"=>"200", "size"=>"3395"}]
[1] tail.0: [[1438176430.000000000, {}], {"host"=>"192.168.2.20", "user"=>"-", "method"=>"GET", "path"=>"/cgi-bin/try/", "code"=>"200", "size"=>"3395"}]
[2] tail.0: [[1438176430.000000000, {}], {"host"=>"192.168.2.20", "user"=>"-", "method"=>"GET", "path"=>"/cgi-bin/try/", "code"=>"200", "size"=>"3395"}]
To test it out, save the input in a file called input.log and the Fluent Bit configuration in a file called fluent-bit.yaml and run the below docker command
docker run \\
	-v $(pwd)/input.log:/input/input.log \\
	-v $(pwd)/fluent-bit.yaml:/fluent-bit/etc/fluent-bit.yaml \\
	-ti cr.fluentbit.io/fluent/fluent-bit:3.1 \\
	/fluent-bit/bin/fluent-bit -c /fluent-bit/etc/fluent-bit.yaml
Fluent Bit Multiline Parser
Logs that span multiple lines, such as stack traces, are challenging to handle with simple line-based parsers. Fluent Bit’s multiline parsers are designed to address this issue by allowing the grouping of related log lines into a single event. This is particularly useful for handling logs from applications like Java or Python, where errors and stack traces can span several lines.
Built In Multiline Parsers
Fluent Bit has many built-in multiline parsers for common log formats like Docker, CRI, Go, Python and Java.
Here’s an example of using a built-in multiline parser for Java logs:
pipeline:
  inputs:
    - name: tail
      path: /input/input.log
      refresh_interval: 1
      multiline.parser: java
      read_from_head: true

  outputs:
    - name: stdout
      match: '*'
This configuration will group related multiline log events together, such as Java exceptions with their stack traces. For example the below Java logs.
single line...
Dec 14 06:41:08 Exception in thread "main" java.lang.RuntimeException: Something has gone wrong, aborting!
    at com.myproject.module.MyProject.badMethod(MyProject.java:22)
    at com.myproject.module.MyProject.oneMoreMethod(MyProject.java:18)
    at com.myproject.module.MyProject.anotherMethod(MyProject.java:14)
    at com.myproject.module.MyProject.someMethod(MyProject.java:10)
    at com.myproject.module.MyProject.main(MyProject.java:6)
another line...
Fluent bit will generate the below output.
[0] tail.0: [[1724826442.826437982, {}], {"log"=>"single line...
"}]
[1] tail.0: [[1724826442.826444682, {}], {"log"=>"Dec 14 06:41:08 Exception in thread "main" java.lang.RuntimeException: Something has gone wrong, aborting!
    at com.myproject.module.MyProject.badMethod(MyProject.java:22)
    at com.myproject.module.MyProject.oneMoreMethod(MyProject.java:18)
    at com.myproject.module.MyProject.anotherMethod(MyProject.java:14)
    at com.myproject.module.MyProject.someMethod(MyProject.java:10)
    at com.myproject.module.MyProject.main(MyProject.java:6)
"}]
[2] tail.0: [[1724826442.826444682, {}], {"log"=>"another line...
"}]
To test it out, save the input in a file called input.log and the fluent configuration in a file called fluent-bit.yaml and run the below docker command
docker run \\
	-v $(pwd)/input.log:/input/input.log \\
	-v $(pwd)/fluent-bit.yaml:/fluent-bit/etc/fluent-bit.yaml \\
	-ti cr.fluentbit.io/fluent/fluent-bit:3.1 \\
	/fluent-bit/bin/fluent-bit -c /fluent-bit/etc/fluent-bit.yaml
Whitepaper: Getting Started with Fluent Bit and OSS Telemetry Pipelines
Getting Started with Fluent Bit and OSS Telemetry Pipelines: Learn how to navigate the complexities of telemetry pipelines with Fluent Bit.
Custom Fluent Bit Parsers
Why Custom Parsers are Required
When working with unique or uncommon log formats, the built-in parsers may not be sufficient. Fluent Bit allows you to define custom parsers using regular expressions (Regex). Custom parsers provide the flexibility to handle any log format that the built-in options may not cover.
Use Case: Handling a Custom Log Format
Consider the following log entry, which uses semicolons (;) to separate key-value pairs:
key1=some_text;key2=42;key3=3.14;time=2024-08-28T13:22:04 +0000
key1=some_text;key2=42;key3=3.14;time=2024-08-28T13:22:04 +0000
This log line contains several fields, including a text field (key1), an integer field (key2), a float field (key3), and a timestamp (time).
Why Built-In Parsers Won’t Work
Fluent Bit’s built-in parsers, such as JSON or Logfmt, are not suitable for this log format because:
- The log uses semicolons (;) as delimiters instead of commas or spaces.
- It contains a combination of data types (strings, integers, floats, and timestamps).
- None of the default parsers expect the key=value;key=value format structure.
This is where custom parsers come in, allowing us to define how Fluent Bit should interpret this log format.
Step 1: Create the Custom Parser Configuration
To handle the custom log format, we will define a parser using a regular expression in a parsers.conf file.
[PARSER]
    Name        custom_kv_parser
    Format      regex
    Regex       ^key1=(?<key1>[^\\\\;]+);key2=(?<key2>[^\\\\;]+);key3=(?<key3>[^\\\\;]+);time=(?<time>[^;]+)$
    Time_Key    time
    Time_Format %Y-%m-%dT%H:%M:%S %z
Types key1:string key2:integer key3:float- Name: We name the parser custom_kv_parser for identification.
- Format: Since the log format is non-standard, we use regex to create a custom parser.
- Regex: The regular expression ^key1=(?<key1>[^\\\\;]+);key2=(?<key2>[^\\\\;]+);key3=(?<key3>[^\\\\;]+);time=(?<time>[^;]+)$ matches the custom log line and captures the relevant fields.
- The expression uses named capture groups (e.g., (?<key1>…)) to assign values to specific fields.
- Time_Key and Time_Format: Specifies the key and format of the timestamp to ensure correct time handling.
- Types: Assigns data types to the extracted fields to ensure they are processed correctly (e.g., key2 as an integer and key3 as a float).
Step 2: Configure Fluent Bit to Use the Custom Parser
Now, we configure Fluent Bit to use this custom parser to process logs. In the main Fluent Bit configuration file (fluent-bit.yaml), we specify the input source and link it to our custom parser.
pipeline:
  inputs:
    - name: tail
      path: /input/input.log
      refresh_interval: 1
      parser: custom_kv_parser
      read_from_head: true

  outputs:
    - name: stdout
      match: '*'

service:
  parsers_file: /custom/parser.conf
- INPUT: Specifies the tail input plugin to read log files from /var/log/custom_logs.log.
- Parser: Links the custom_kv_parser to the log source to parse the logs.
OUTPUT: Directs the parsed log entries to the standard output in JSON format.
Step 3: Running Fluent Bit
Once the configuration files are ready (fluent-bit.conf and parsers.conf), you can run Fluent Bit to start processing the logs.
docker run \\
	-v $(pwd)/custom_parsers.conf:/custom/parser.conf \\
	-v $(pwd)/input.log:/input/input.log \\
	-v $(pwd)/fluent-bit.yaml:/fluent-bit/etc/fluent-bit.yaml \\
	-ti cr.fluentbit.io/fluent/fluent-bit:3.1 \\
	/fluent-bit/bin/fluent-bit -c /fluent-bit/etc/fluent-bit.yaml
Step 4: Check the Output
Fluent Bit will process the logs according to the custom parser and output structured JSON data. Here’s the expected result:
Output
[0] tail.0: [[1724851324.000000000, {}], {"key1"=>"some_text", "key2"=>42, "key3"=>3.140000}]
[1] tail.0: [[1724851324.000000000, {}], {"key1"=>"some_text", "key2"=>42, "key3"=>3.140000}]
The output shows that Fluent Bit successfully parsed the log line and structured it into a JSON object with the correct field types. This custom parser approach ensures that even non-standard log formats can be processed and forwarded.
Understanding Different Parser Formats
Logs are simple strings, with their structure defined by the format used. Fluent Bit supports four formats for parsing logs. When configuring a custom parser, you must choose one of these formats:
- JSON: Ideal for logs formatted as JSON strings. Use this format if your application outputs logs in JSON.
Configuration Example:
[PARSER]
    Name        docker
    Format      json
    Time_Key    time
    Time_Format %Y-%m-%dT%H:%M:%S %z
Sample Log Entry:
{"key1": 12345, "key2": "abc", "time": "2006-07-28T13:22:04Z"}Internal Representation After Processing:
[1154103724, {"key1"=>12345, "key2"=>"abc"}]
- Regex: Uses regular expressions for pattern matching and extracting complex log data. This format provides flexibility to interpret and transform log strings according to custom patterns. This format is used by most of our in-built and custom parsers.
- Logfmt: This format represents logs as key-value pairs, making it a simple and efficient choice for structured logging.
Configuration Example:
[PARSER]
    Name        logfmt
    Format      logfmt
Sample Log Entry:
key1=val1 key2=val2 key3
Internal Representation After Processing:
[1540936693, {"key1"=>"val1", "key2"=>"val2", "key3"=>true}]
LTSV (Labeled Tab-Separated Values): Similar to Logfmt but uses tab characters to separate fields. This format is particularly useful for logs with many fields.
Configuration Example for Apache Access Logs:
[PARSER]
    Name        access_log_ltsv
    Format      ltsv
    Time_Key    time
    Time_Format [%d/%b/%Y:%H:%M:%S %z]
    Types       status:integer size:integer
Sample Log Entry:
host:127.0.0.1 ident:- user:- time:[10/Jul/2018:13:27:05 +0200] req:GET / HTTP/1.1 status:200 size:16218 referer:<http://127.0.0.1/> ua:Mozilla/5.0 (X11; Fedora; Linux x86_64; rv:59.0) Gecko/20100101 Firefox/59.0Internal Representation After Processing:
[1531222025.000000000, {"host"=>"127.0.0.1", "ident"=>"-", "user"=>"-", "req"=>"GET / HTTP/1.1", "status"=>200, "size"=>16218, "referer"=>"<http://127.0.0.1/>", "ua"=>"Mozilla/5.0 (X11; Fedora; Linux x86_64; rv:59.0) Gecko/20100101 Firefox/59.0"}]Fluent Bit Parsing & Filtering
What Comes First: Filtering or Parsing?
In Fluent Bit, parsing typically occurs before filtering. This is because filters often rely on the structured data produced by the parser to make decisions about what to include, modify, or exclude from the log stream.
After parsing, filters can be applied to refine the logs further:
- Remove unnecessary fields: Drop fields that are not needed for further analysis.
- Drop certain log levels: Focus on logs of specific severity levels, such as ERROR or WARN.
- Enrich logs with additional metadata: Add context to logs by including fields like environment, hostname, or region.
For example, you can use a grep filter to keep only logs with specific log levels and a record_modifier filter to add an “env” field:
filters:
  - name: grep
    match: '*'
    regex:
      level: ^(ERROR|WARN|INFO)$

  - name: record_modifier
    match: '*'
    records:
      - env: production
This refines the logs to include only the specified levels and adds a contextual “env” field, making the logs more useful for downstream analysis.
Best Practices
- Start by examining your raw log data
- Use built-in parsers when possible
- Test custom regex patterns thoroughly
- Use tools like (rubular.com / AI) wherever required
- Apply filters to reduce noise and enrich data
Conclusion
With Fluent Bit’s parsing capabilities, you can transform logs into actionable insights to drive your technical and business decisions. By leveraging its built-in and customizable parsers, you can standardize diverse log formats, reduce data volume, and optimize your observability pipeline. Implementing these strategies will help you overcome common logging challenges and enable more effective monitoring and analysis.
Manning Book: Fluent Bit with Kubernetes
Master log forwarding in Kubernetes. Download Fluent Bit with Kubernetes now!


