
Get the most out of SLOs
Service Level Objectives (SLOs) help teams address the problem of monitoring end user experience on top of rapidly evolving and ephemeral infrastructure. Chronosphere SLO’s simplify this endeavor. By providing Chronosphere SLO’s with the proper queries to define successes and failures, the Chronosphere SLOs feature generates the telemetry, charts, and alerts to let teams monitor their objectives over time. Using Chronosphere SLOs lets users focus on the end user instead of the details of how to make SLO data useful.
To get the most out of SLOs, Chronosphere supports many additional types of configuration. This blog post suggests a few ways to configure SLOs so that they are not only easier to setup, but more powerful and adaptive to your environment. End users and Central Observability teams will get value from reading the tips below.
1. Go Queryless: Effortless SLO creation with the Builder
Writing PromQL can be a major barrier to adoption of SLOs. To address this pain, Chronosphere SLO’s leverage Chronosphere Lens service discovery to support SLO creation without writing any queries. Easier SLO creation makes it easier for all teams to adopt better observability practices regardless of PromQL expertise.
Chronosphere Lens discovers services based on the telemetry in your environment. Services are discovered by analyzing known metric sets associated with shared technologies. For example, gRPC services emit a number of standard metrics with the grpc_ prefix, and Lens can identify the relevant gRPC metrics needed to create an SLO. The SLO builder uses these metrics to easily build the relevant input queries.
By selecting the “Builder” mode, a user can walk through creating an SLO by selecting a few form fields and then, boom, you’re tracking an objective on your service. Lets walk through this in detail with an example.
Consider a service called BillingSvc that handles billing transactions for your company. In this example, we will create an SLO for the PayForOrder endpoint that will track whether 99.9% of requests happen within 1 second.
First, enter an Objective of 99.9 based on our plan above to verify 99.9% of requests fall within a certain threshold.
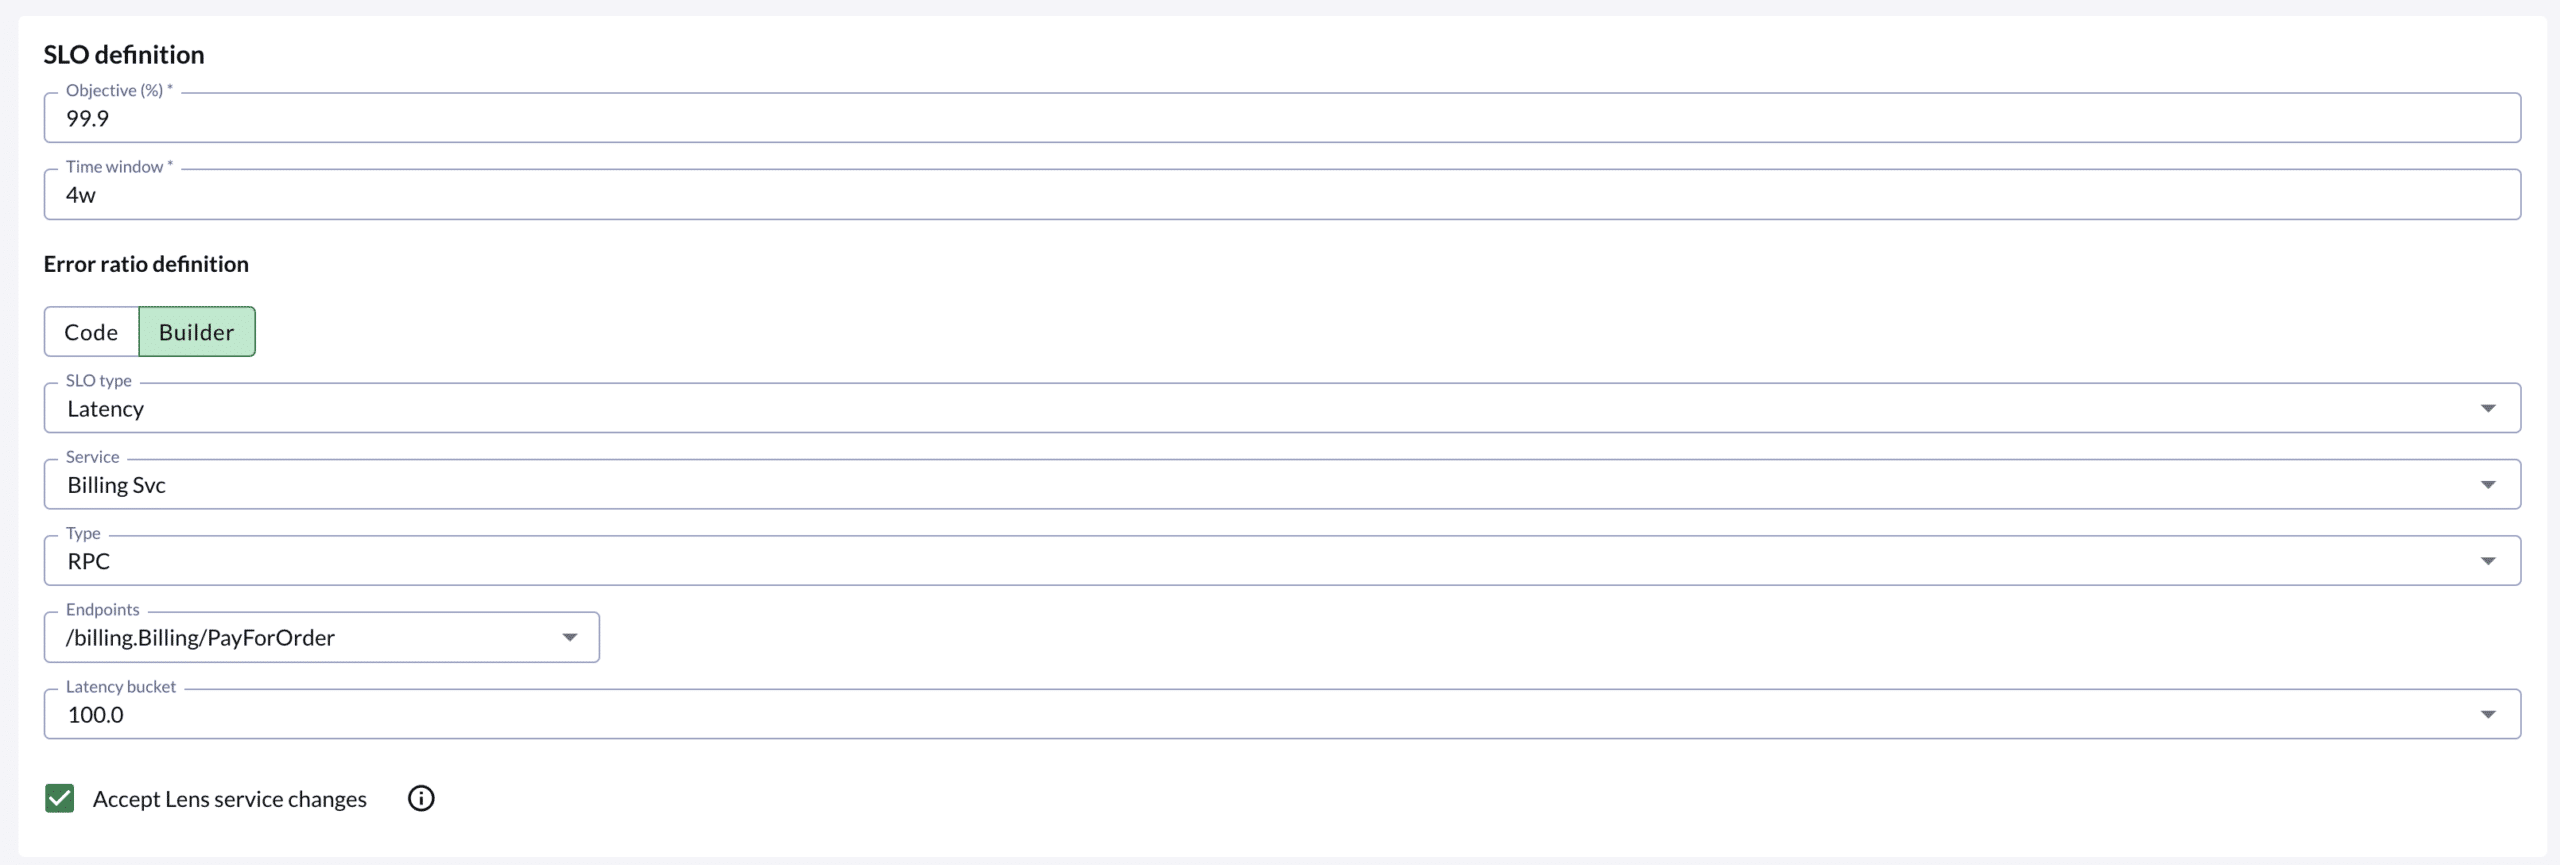
Next, select the “Builder Tab” and fill out the following fields
- SLO type: in this example we want
Latency. The builder also supports creating Availability SLOs. - Service:
BillingSvc(select this from the dropdown) - Type:
RPC. This dropdown lets the user pick which Lens component to use to track the SLO. RPC in this case uses RPC metrics for this service to track latencies. - Endpoints:
/billing.Billing/PayForOrder - Latency Bucket:
100. The latency SLO will mark as an error every sample that is greater than 1 second (100 milliseconds).
You’ve now defined an SLO for the BillingSvc service, measuring the latency of the /billing.Billing/PayForOrder endpoint, targeting 99% of requests taking less than or equal to 1 second to complete.
If you want to understand more deeply the queries that the builder generates, flip over to the Code Config tab to see how this SLO manifests in Terraform Config. This will show you the raw queries we generate based on the inputs provided above.
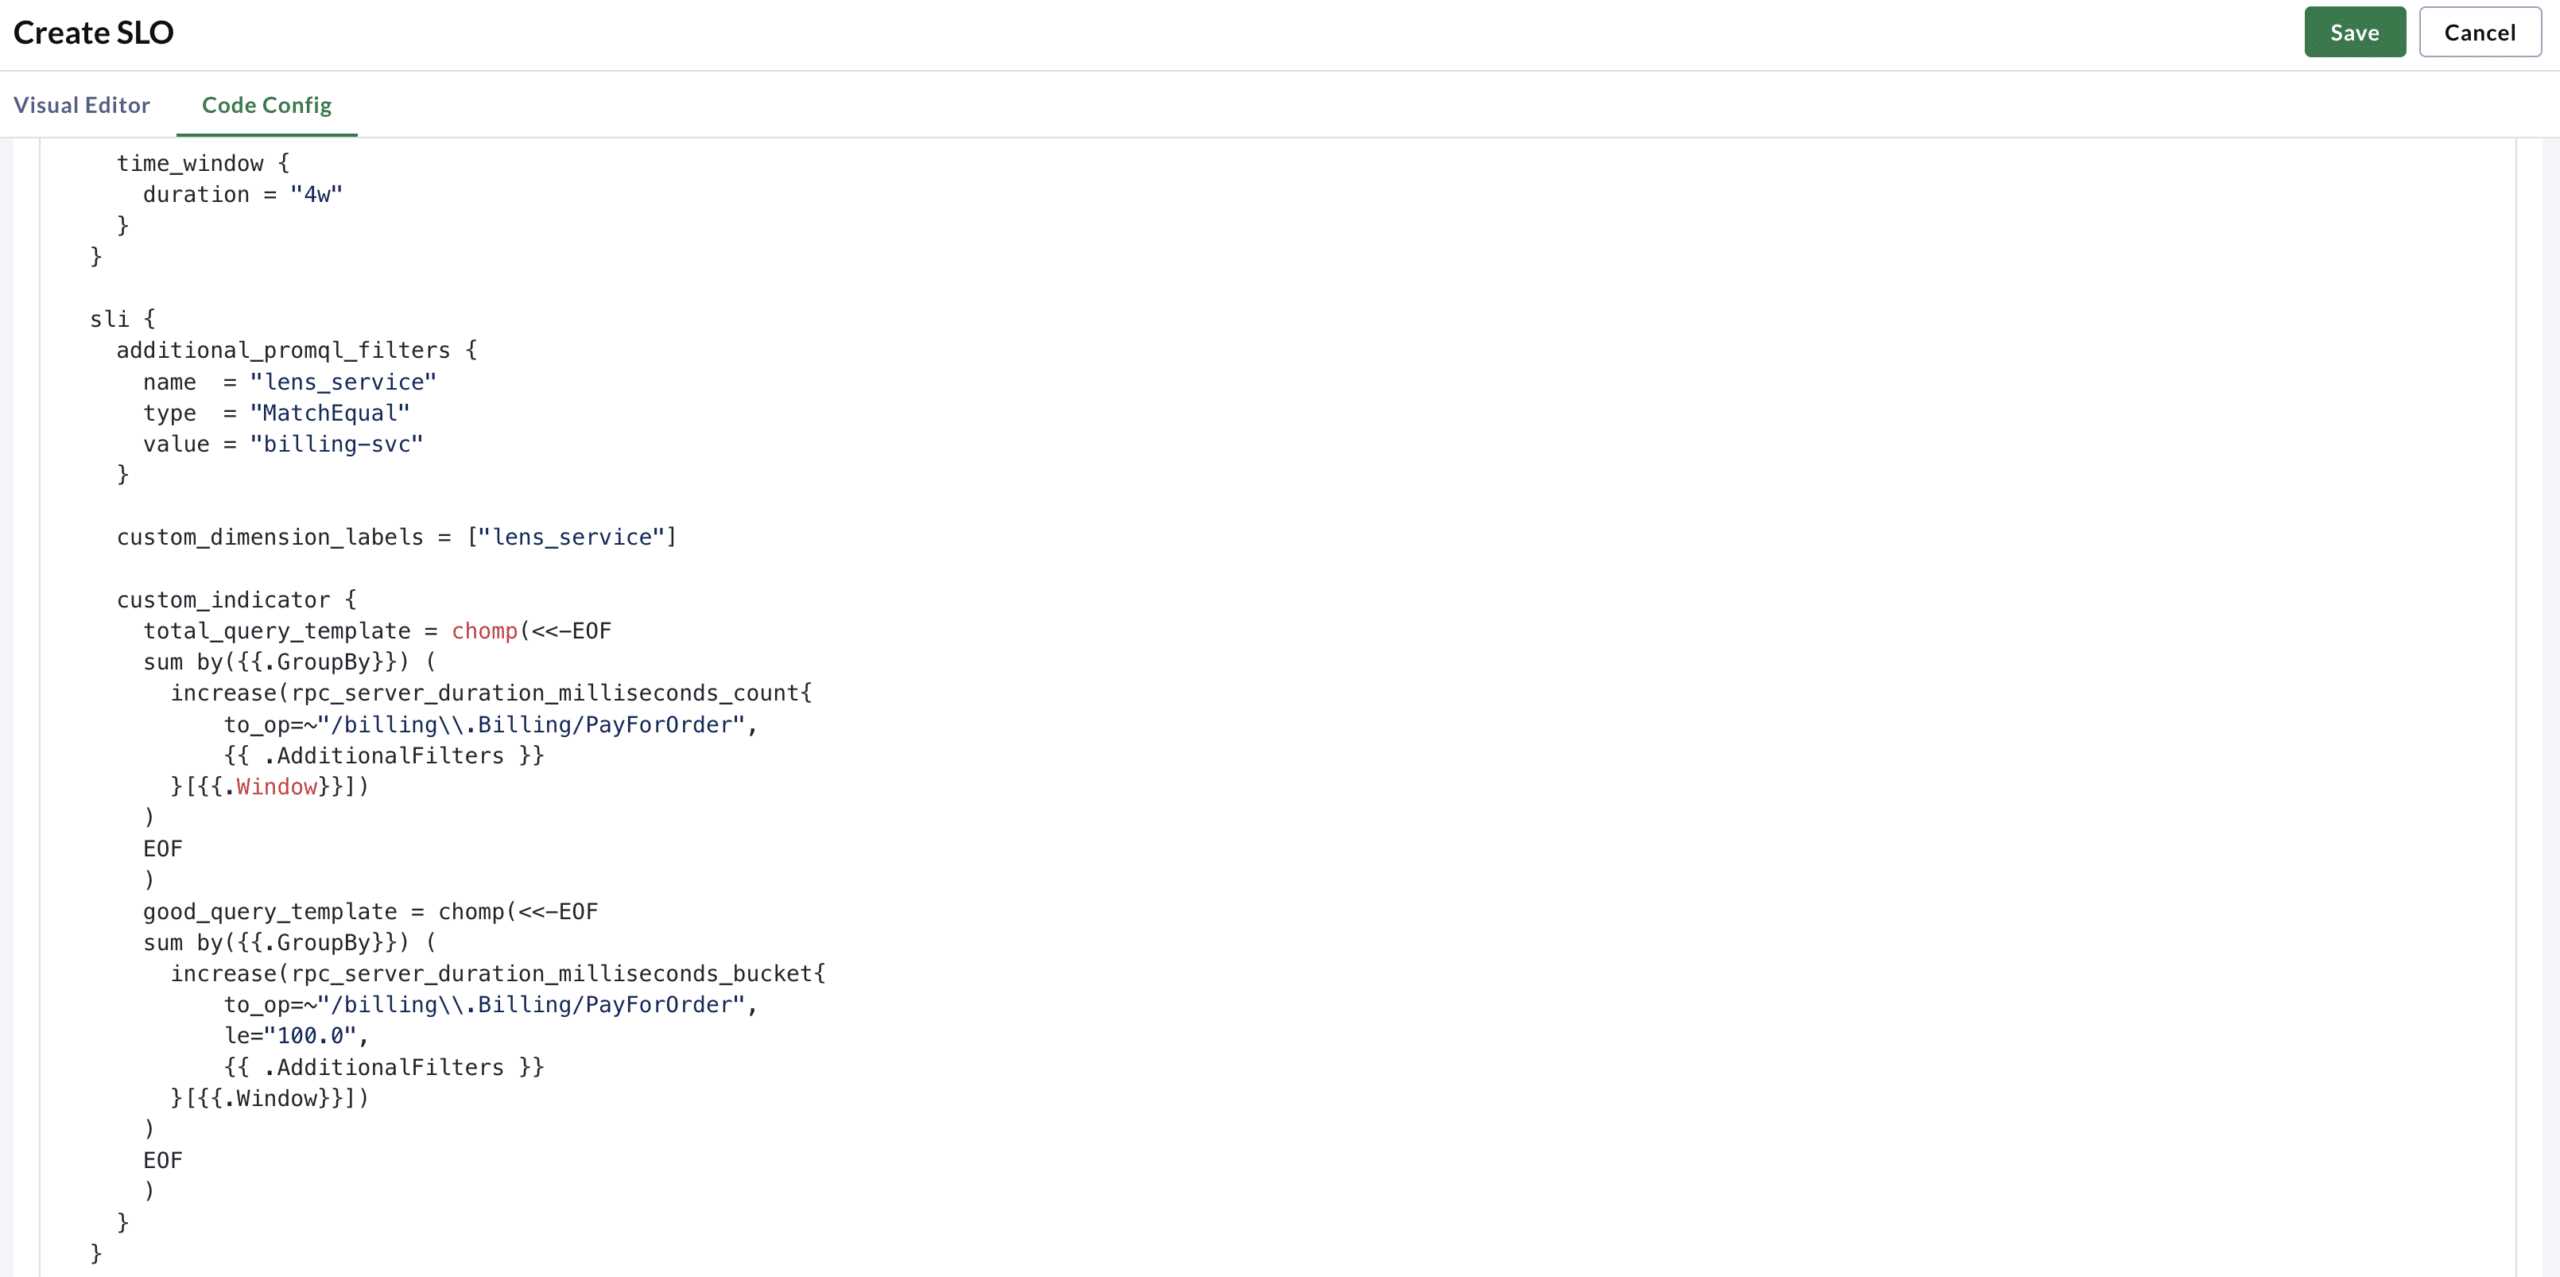
Writing PromQL can be hard for users without expertise. Using the SLO builder helps you think in terms of your services and technologies and not query debugging.
2. Track many budgets with one SLO
A single error budget might not tell the whole story, or the right story, for a service’s performance. Chronosphere SLOs support tracking multiple budgets for a single SLO to give a granular perspective on how a service performs across different dimensions like environments or availability zones.
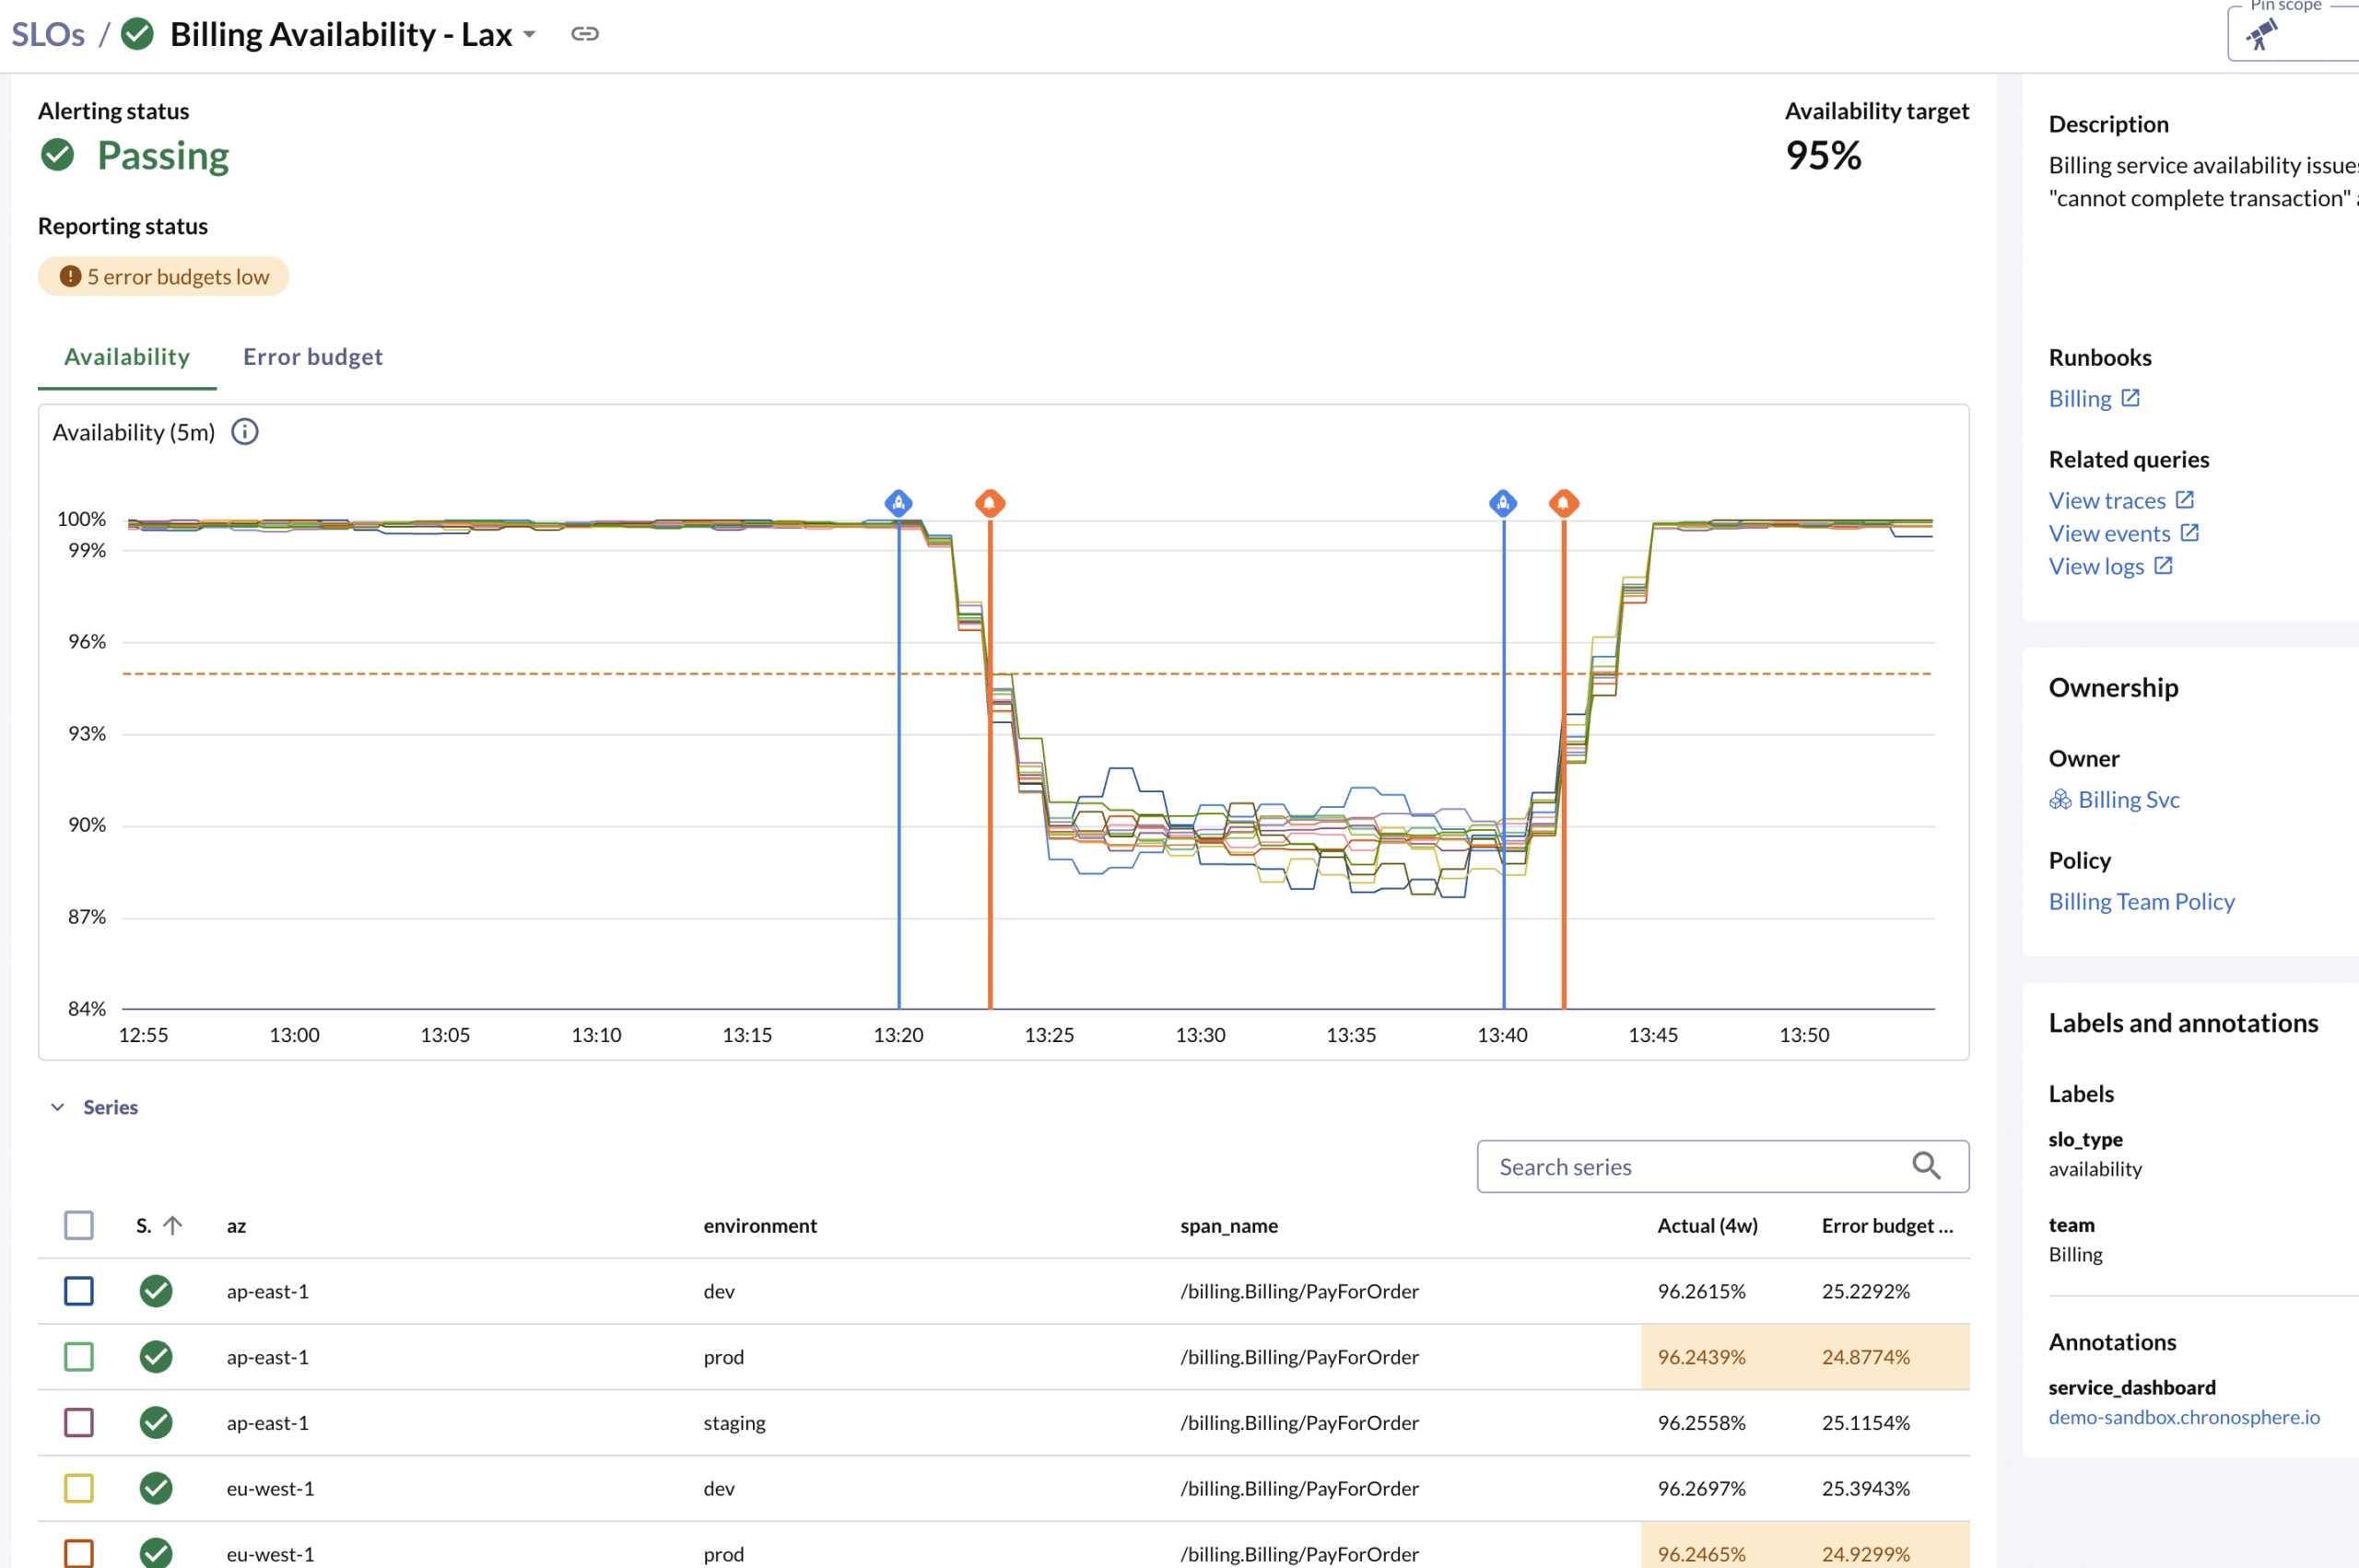
The screenshot above shows both multiple lines on the chart and multiple rows in the grid below all tracking separate budgets.
Dimensions can be any label that’s part of the SLO query result set. When added, Chronosphere SLOs track a new budget for every permutation of unique dimension values. This gives users a fine-grained visibility into an SLO’s performance while rolling up higher level statuses making it easy to tell whether things are healthy or not.
For example, consider the scenario where `BillingSvc` is deployed across many environments (dev, prod, staging). We don’t want misses in dev to affect the production SLO. Therefore, in this case, the BillingSvc SLO can add the environment label as a dimension label. This will track a separate budget for each value in the environment label on the underlying metric. Furthermore, if a new environment is added (ex. alpha), then a new budget will automatically be created and tracked without the need to update the SLOs configuration.
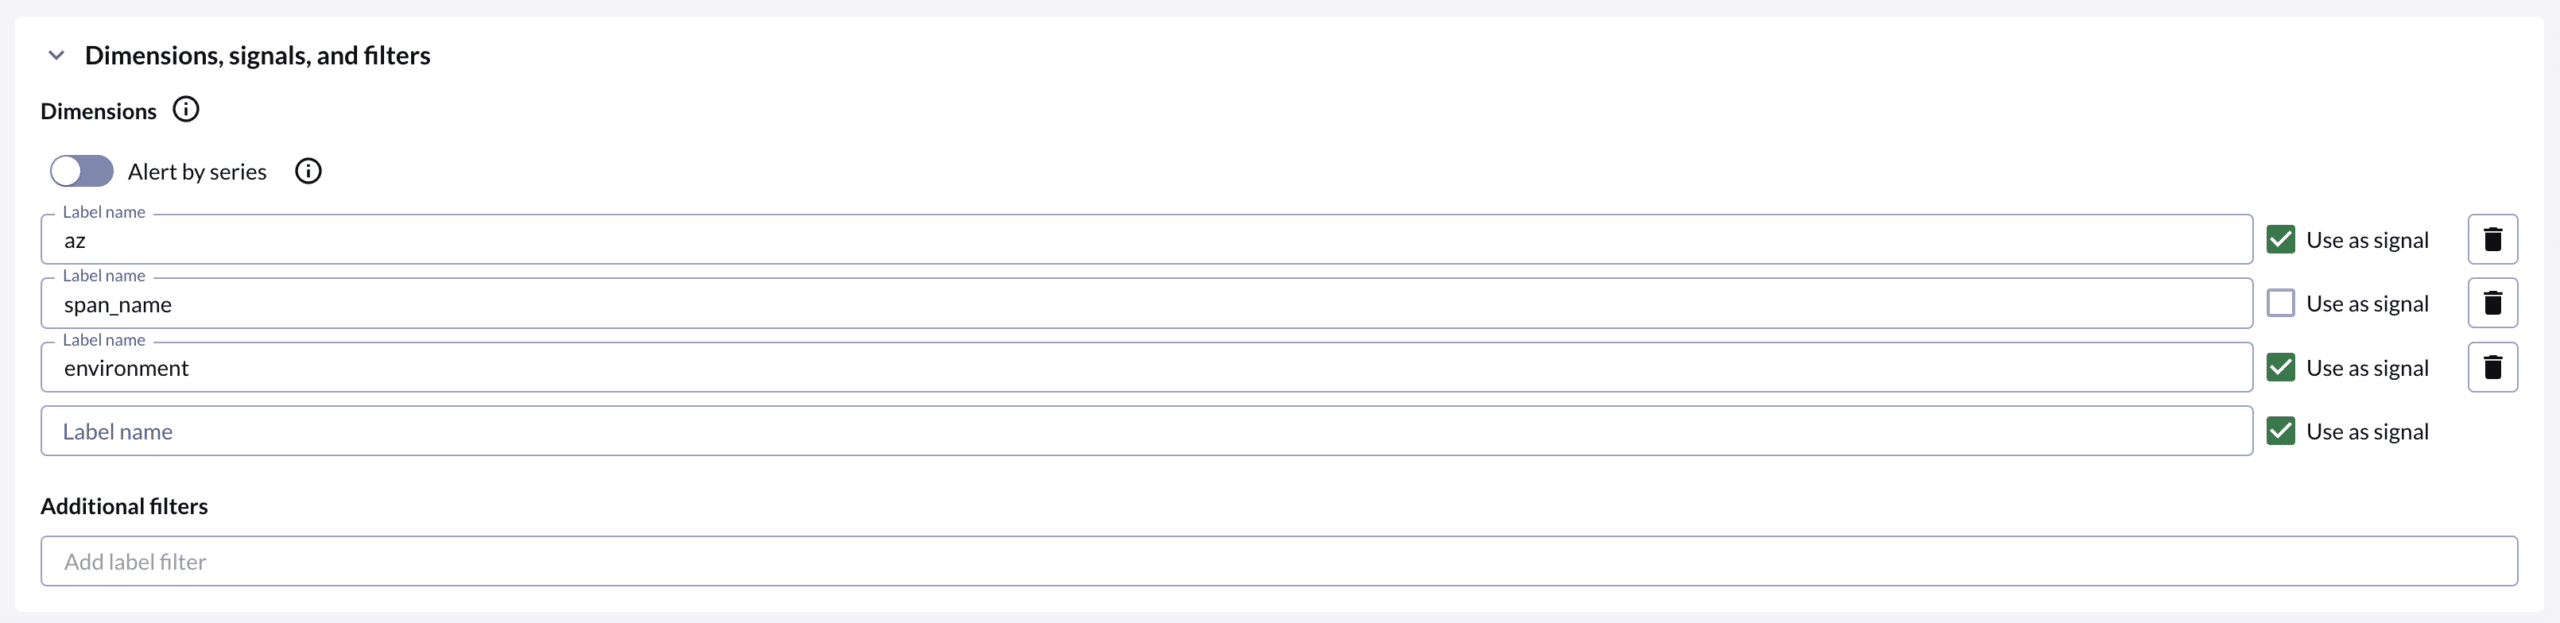
By checking the “Use as Signal” checkbox, Chronosphere SLOs will create separate alerts per alerting signal. For the environment scenario, it makes sense to check the “Use as Signal” box because users expect different alerts based on problems in pre-production environments from customer facing issues. Consider the scenario where you additionally want to track a budget per billing endpoint using the span_name label. In this scenario, a user might choose to get a single notification for the failing SLO regardless of which endpoint is failing. In this case, they would leave the “Use as Signal” checkbox unchecked.
Learn More About Chronosphere SLOs
Easily create and manage SLOs and Error Budgets in containerized, microservices environments
3. Filter budgets with Pinned Scopes
Understanding system performance across multiple SLOs with multiple budgets can be overwhelming. Pinned Scopes in Chronosphere provide a powerful way to filter your SLO data and status, giving you an immediate, focused view of the reliability metrics that matter most to you at any given moment. This can be useful to find the information relevant to a given scenario, be it in an outage or developing a report.
Chronosphere lets customers use scopes to denote common labels that appear on their telemetry. By configuring these scopes, users can then filter on a variety of pages across the app. By pinning the scopes on the top level of the Chronosphere app, SLO charts will reflect the SLO metrics filtered by the scope value. Additionally, the SLOs and their status can be filtered by these scopes on the SLO list page if the SLOs use the same scope values as part of their dimension set.
Scopes are configured on the “Scope Configuration” page in the Admin menu. Once the scopes are set up, when configuring an SLO, add the relevant scopes to the dimension set.
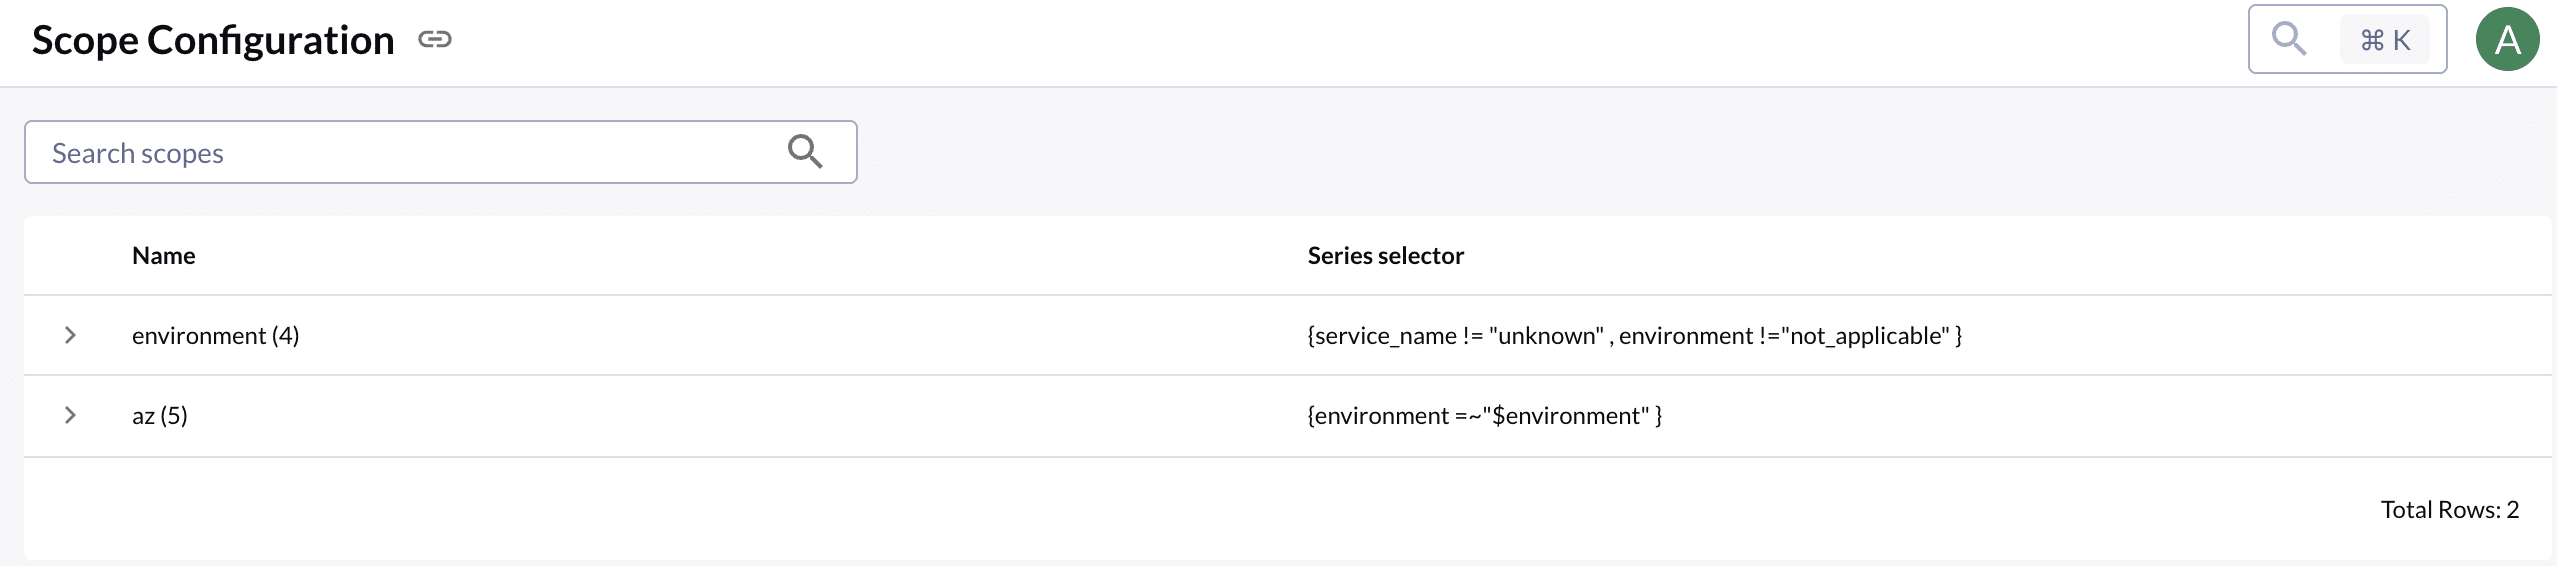
Once done, you can use them in both the SLO List page and the SLO Details page to filter SLO status and data.
SLO List Page
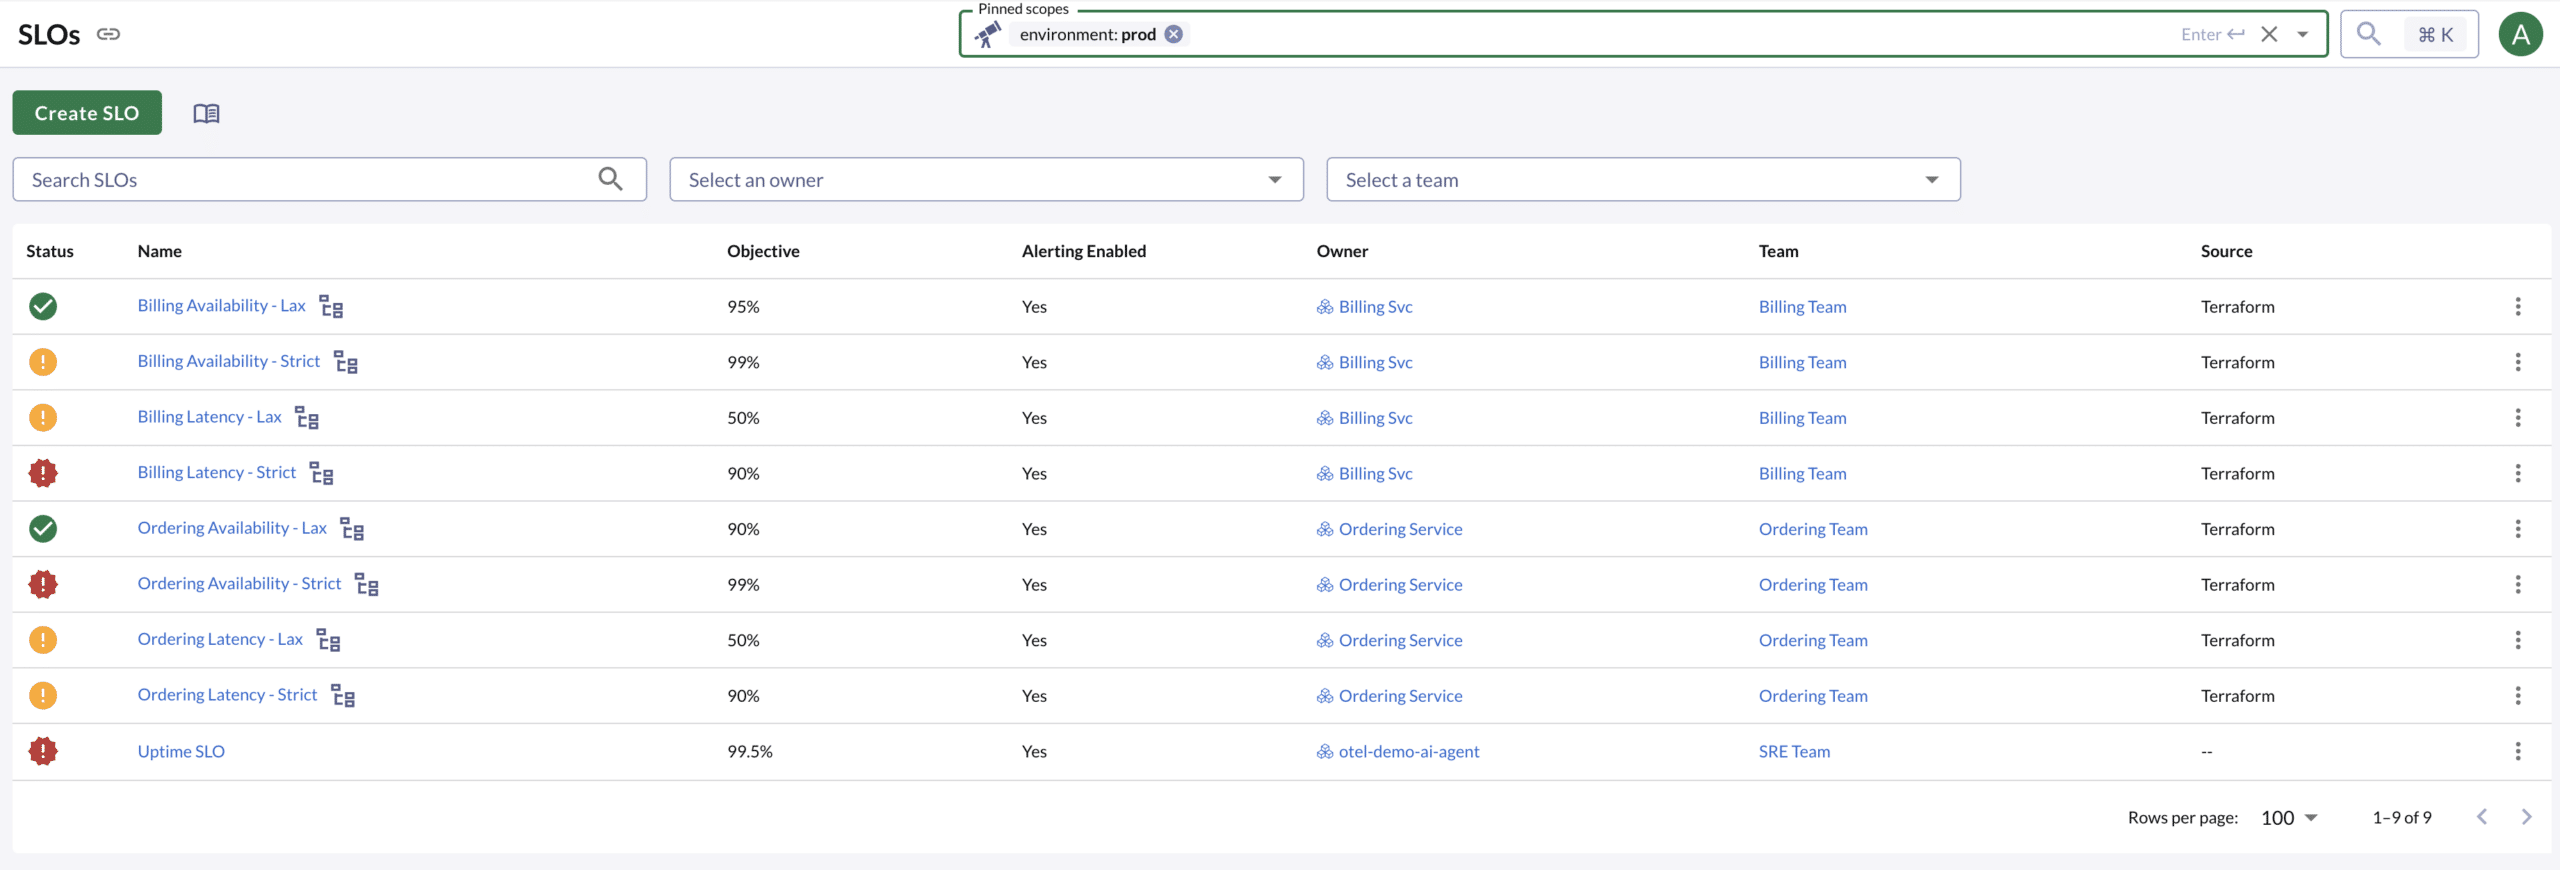
This example is filtering the SLO statuses using the environment scope set to prod. This is a common case where you want to find the relevant customer-facing SLO statuses that might be obscured by issues in pre-prod environments.
To get the most out of Pinned Scopes, coordinate label conventions across teams to ensure filtering is consistent and meaningful.
4. Bonus tips & advanced tricks
Using runbooks: Link runbooks to SLOs for rapid incident response.
SLO alerts are most reliably indicative of a real customer issue, but they don’t always lend themselves to be easily debugged. Tagging the right runbook on an SLO will ensure that the right information is readily available to use when debugging SLO burn.
GitOps automation: Manage SLOs as code with Terraform, API, or ChronoCLI.
SLOs are most powerful when they are standardized across an organization. To enable these types of automations, as with all other Chronosphere entities, SLOs can be managed via our external APIs.
Attach your SLO to a service to maximize context and investigation capabilities.
Identifying a service’s health at a glance can be challenging. Relatedly, when an SLO burns, the cause of the burn can be hard to identify. When SLOs are added to Chronosphere Services, the SLO status is included in service health calculations and relevant service page charts are available on the SLO details page.
SLOs have feature parity with monitors: Labels, annotations, and notification policies all work in the same way
Chronosphere can alert end users with both Monitors and SLOs. Have no fear! All of the useful features built for monitors, like notification policies, labels, and annotations can be used the same on SLOs.
SLO Metrics are queryable
Many companies want to control how they report on the status of their SLOs. Therefore, all of the underlying metrics that power Chronosphere SLOs are available to end users. Prefixed with lens:slo:* metrics like lens:slo:errors, lens:slo:totals , lens:slo:burn_rate:ratio30d are all available to use in the Metrics Explorer and to create Dashboards.
Conclusion
Chronosphere SLOs empower teams to easily track and manage the reliability of their services by abstracting away the underlying complexities of data collection and query construction. By leveraging the builder, dimensions, and scopes, users can create a robust and adaptable SLO setup for modern tech stacks. These features make Chronosphere SLOs an essential tool for ensuring optimal service performance and accelerating incident response.
O’Reilly eBook: Cloud Native Observability
Master cloud native observability. Download O’Reilly’s Cloud Native Observability eBook now!