


A recent survey uncovered a fact that I found extremely depressing: Only 1% of companies are meeting their mean time to repair targets. That’s right, that means 99% of companies miss their targets. Before you call shenanigans, let me explain the methodology: The survey, which went to 500 engineers and engineering leaders at U.S.-based companies first asked: “How long, on average, does it usually take your company to repair an issue?” Next, the survey asked them to answer “What is your target mean time to repair an issue?” The results were grim. Only 7 of the 500 responded that they met or exceeded their MTTR goal (their average MTTR was the same or less than their target MTTR).
How much did they miss by? The average company was aiming for an MTTR of 4.7 hours, but actually achieved an MTTR of 7.8 hours. Woof. Why and HOW are we so bad at this? I have a few theories. Let’s dig into them.
No one knows what mean time to repair really means
MTTR stands for “mean time to repair” and is a measurement of how long it takes from the first alert that something has gone wrong to remediating the issue. I state that like it’s a fact, but I’ve also seen MTTR stand for:
- Mean time to restore
- Mean time to respond
- Mean time to remediate
Mean time to rachel
But given we specifically asked in the survey, “What is your mean time to repair,” I feel confident, I know which “r” people were answering for. But then again, what does repair actually mean? I asked several people and got two different schools of thought:
- The time it takes to get systems back to some semblance of operation.
- The time it takes to completely fix the underlying problem.
So which is it? That’s one of the reasons that this is impossible to benchmark against your peers. But you CAN benchmark against yourself, and this still doesn’t explain why 99% of companies aren’t meeting their own expectations for MTTR.
Observability tools are failing engineers during critical incidents
My second hypothesis also comes from data within the survey: The observability tooling from alerting to exploration and triage to root cause analysis is failing engineers. Here’s why I say that: When we asked individual contributor engineers what their top complaints about their observability solutions were, nearly half of them said it requires a lot of manual time and labor. Forty-three percent of them said that alerts don’t give enough context to understand and triage the issue.
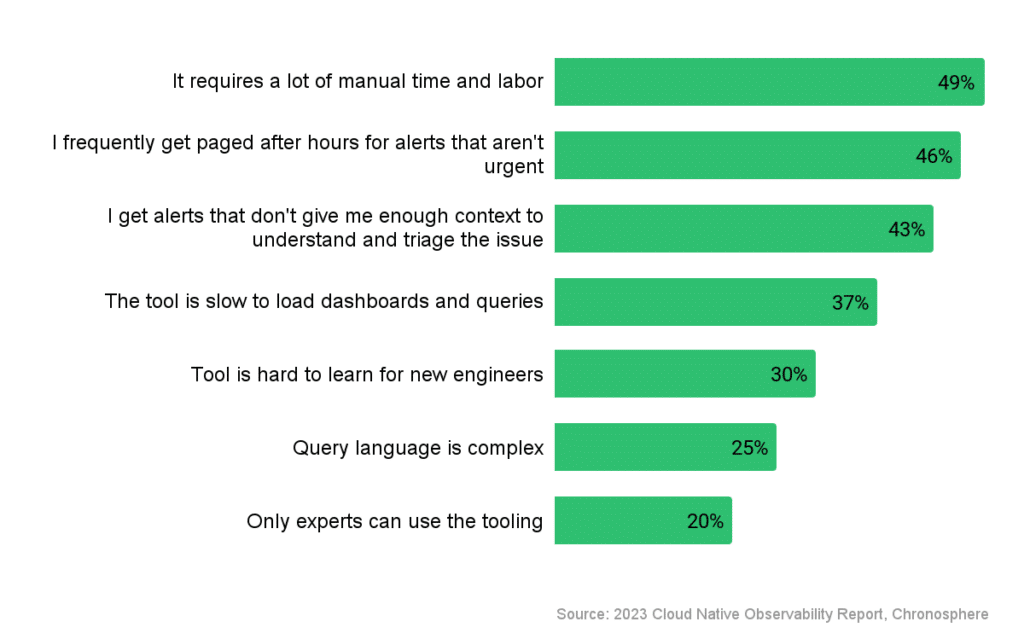
If the tools they’re using to repair the issues take a lot of manual time and labor and don’t provide enough context, that is likely a large part of what is causing companies to miss on their MTTR targets.
Cloud native is a blessing and a challenge
Many leading organizations are turning to cloud native to increase efficiency and revenue. The respondents in this survey reported that their environments were running on average 46% in containers and microservices, a number they expected to increase to 60% in the next 12 months. While that shift has brought many positive benefits, it’s also introduced exponentially greater complexity, higher volumes of data and more pressure on engineering teams who support customer-facing services. When managed incorrectly, it has significant negative customer and revenue impacts.
This isn’t a controversial statement. The overwhelming majority of respondents in the survey (87%) agree that cloud native architectures have increased the complexity of discovering and troubleshooting incidents.

So how do we get better?
If we dissect the MTTR equation, it might look something like this:
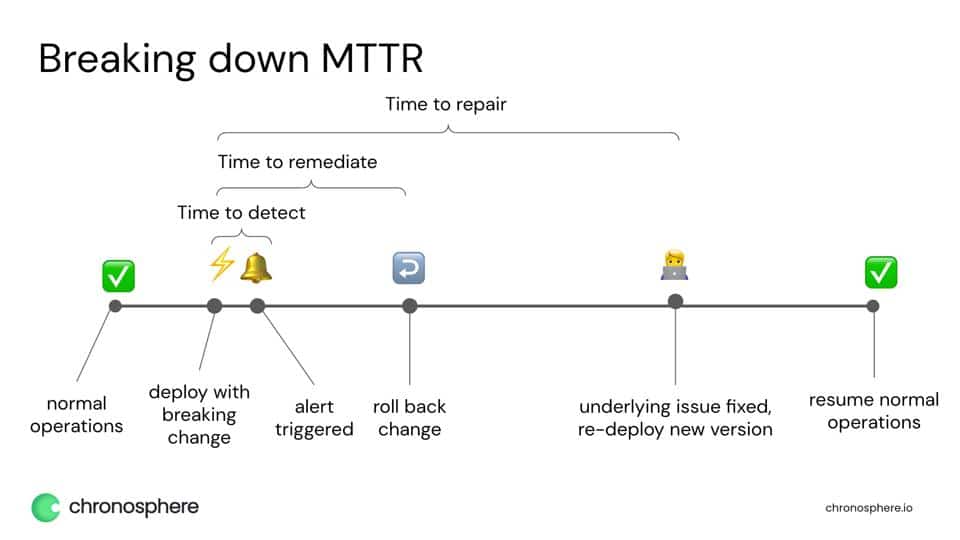
I would start by attacking each piece of the equation and finding ways to shorten each step:
- Time to detect: TTD is often overlooked, but it can be one of the ways you can cut down your MTTR. The key to reducing mean time to detect (MTTD) is making sure you are collecting data as frequently as possible (set a low scrape interval) and your tooling can ingest and generate alerts rapidly. In many industries, this is where seconds make a big difference – for example Robinhood used to have a 4-minute gap between an incident happening and an alert firing. FOUR MINUTES. That’s a long time in a heavily regulated industry with high customer expectations. But by upgrading its observability platform, it shrunk MTTD down to 30 seconds or less.
- Time to remediate: This is the amount of time it takes to stop the customer pain and put a (potentially temporary) fix in place. Once you’ve shrunk the time to detect, you can attack the gap between detection and remediation. This is typically done by providing more context and clear actionable data in the alerts. Easier said than done! In the recent survey we found that 59% of engineers say that half of the incident alerts they receive from their current observability solution aren’t actually helpful or usable. We already saw earlier that 43% of engineers frequently get alerts from their observability solution without enough context to triage the incident. When alerts have context as to what services or customers are affected by an incident and link the engineers to actionable dashboards, the time to remediate shrinks a lot.
- Time to repair: If you’ve optimized the time to detect and the time to remediate, the time to repair actually becomes a less critical metric. Why? Assuming you define time to repair as the time to fix the underlying issue AFTER remediating, that means that customers are not affected while the repair is happening. It’s still something to keep an eye on, as long time to repair often means that teams are stuck in endless troubleshooting loops, but it doesn’t have as direct of an impact on customer satisfaction.
Want to dig into this data further? The whole study that this data is based on is available here. I encourage you to give it a read and reach out to me on Twitter or Mastodon if you have any additional insights to share.


