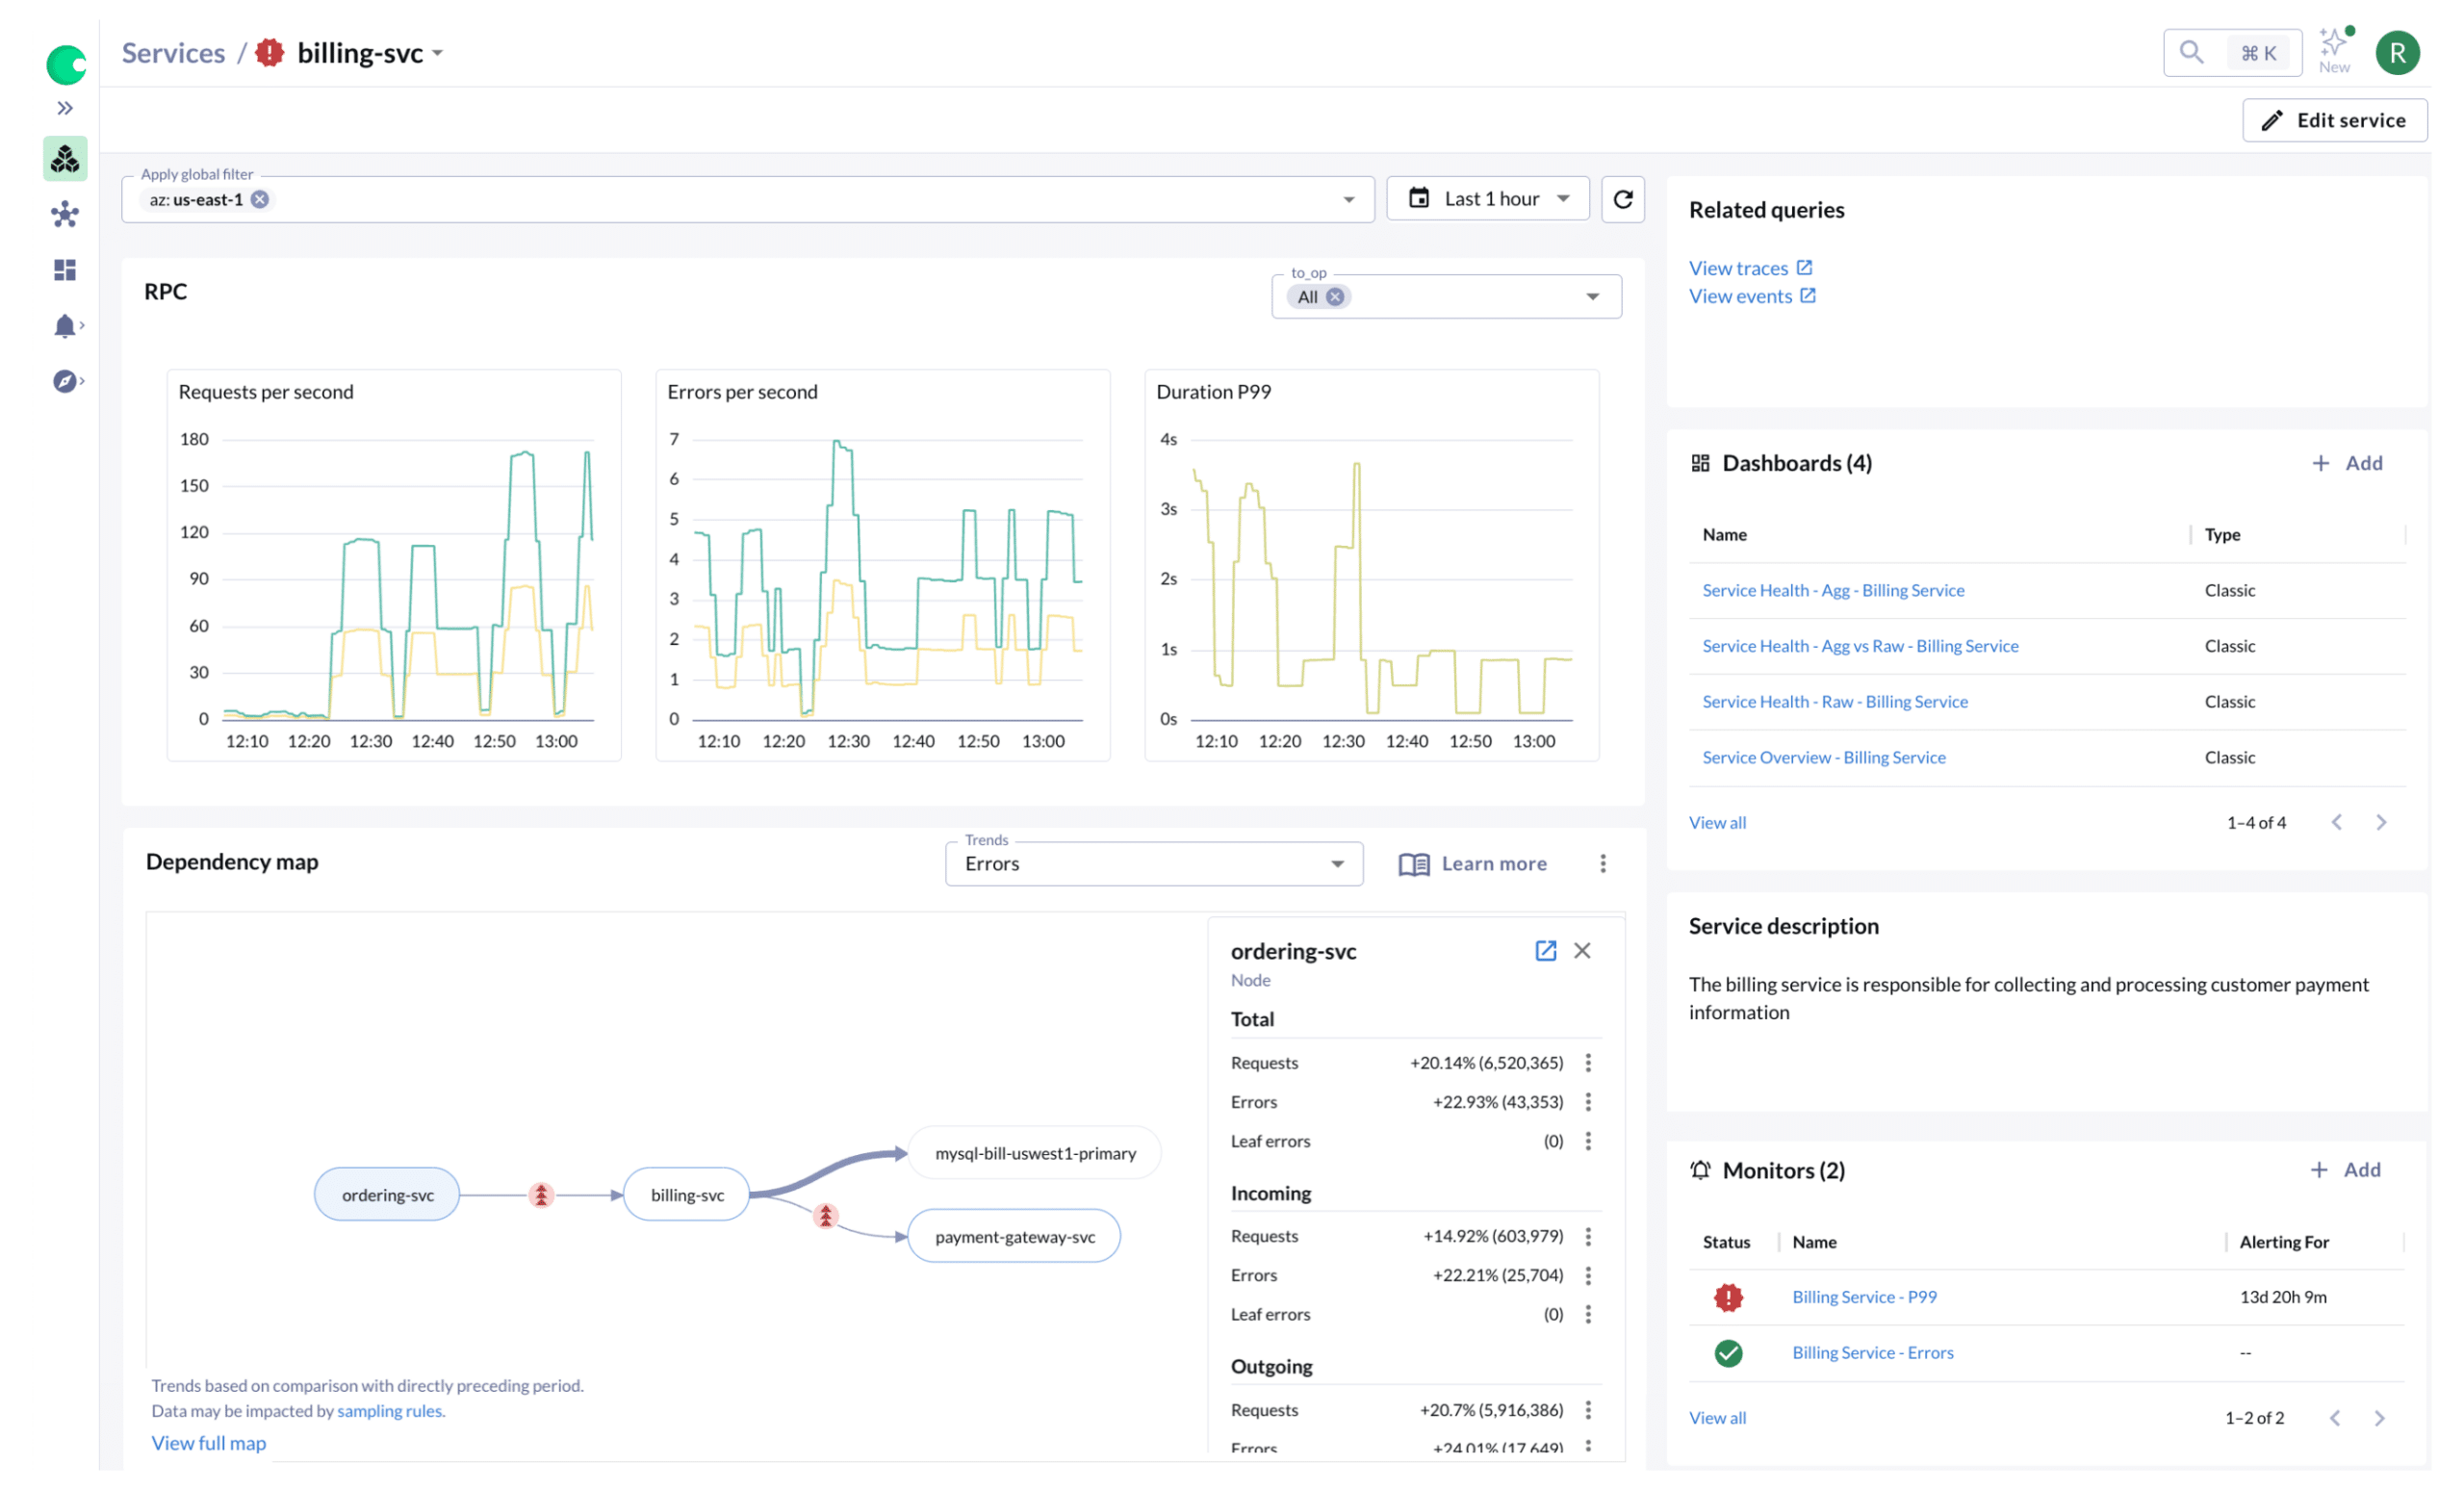
The Observability Platform with Control
Chronosphere is a cloud native observability platform that provides deep insights into every layer of your stack — from the infrastructure to the applications to the business.

Scale, Speed, and Predictability in One Platform
Site reliability, DevOps, and engineering teams worldwide rely on Chronosphere to help them find and fix customer-facing issues faster, while simultaneously wrangling cloud native complexity. With Chronosphere, you gain complete control over your observability costs and access to the industry’s most reliable and scalable observability SaaS platform purpose built for cloud native.
Open Source Data Collection
Organizations no longer need to depend on the black box magic of the monitoring vendor’s proprietary data formats. Avoid vendor lock-in with a solution that ingests data with Prometheus or OpenTelemetry and queries it easily with PromQL.
Import your Prometheus AlertManager alerts and Grafana dashboards, and get better context with alert history. No matter your setup, we can help.
Open source compatible


Control Plane
As data volumes grow, so do costs. However, not all of your observability data is equally important, so why are you treating it all the same?
Chronosphere gives you the power to understand what data is useful and what data is not and then allows you to shape and transform your observability data to fulfill their dashboard and alerting needs without having to store all the data in the raw form. The result is reduced cost and improved performance, giving you back control over your observability costs.
Average customer data reduction after Control Plane transformation
Scalable and reliable data store
Chronosphere has a proven track record of handling hundreds of millions of datapoints per second while maintaining industry leading performance and availability.
How? Purpose-built technology running on single tenanted architecture and a world class operational team that uses Chronosphere to ensure a 99.99%+ uptime
Attained uptime over the past year


Differential Diagnosis (DDx)
Differential Diagnosis (DDx) provides guided, queryless troubleshooting that’s repeatable and scalable. From high-level metric anomalies to detailed trace analysis, DDx reveals what’s changing, what’s not, and where to focus next. It enables everyone on the team to troubleshoot like a seasoned expert—even on day one.
Chronosphere Lens
With Chronosphere Lens, any developer, regardless of tenure or seniority, can rapidly gain the system, organizational, and change context they need to troubleshoot problems.
No longer will the majority of issues get escalated to the few organizational heroes, now every developer can quickly get oriented to the problem at hand.
reduction in time spent troubleshooting
engineering hours saved per year at Affirm

The Observability Platform That Works For You
Manage Runaway Observability Costs
Observability is one of the most expensive items in your budget and the cost is out of balance with the value it delivers.
Chronosphere gives you the power to transform your observability data based on the need, context, and utility, storing only the useful data.The result: reduced operational costs, improved performance, and no more surprise overages.
Boost Observability Reliability and Performance
Without iron clad reliability, you can’t deliver on customer commitments. Optimize performance and availability of critical services and provide real time business insights.
With Chronosphere, you gain access to the most reliable and performance observability platform, so you can find and fix customer impacting issues faster.

Accelerate MTTx
You need your developers to spend less time firefighting and more time building, especially if you have a reduced or flat headcount.
With Chronosphere, developers are the fastest to detect, triage, root cause customer-facing issues, speeding up MTTx so they can get back to the job at hand.
Scale Open Source Tools
You got started with Prometheus metrics, but as you’ve scaled, availability, performance, and usability are suffering and the management overhead increases daily.
Chronosphere offers the best of both worlds: an open source compatible observability solution that takes away the headache of managing your own Prometheus.