Telemetry At Your Fingertips
Chronosphere breaks down silos between telemetry types by delivering correlated telemetry views, which allow developers to seamlessly navigate across all telemetry types: metrics, traces, logs and events, without losing context.
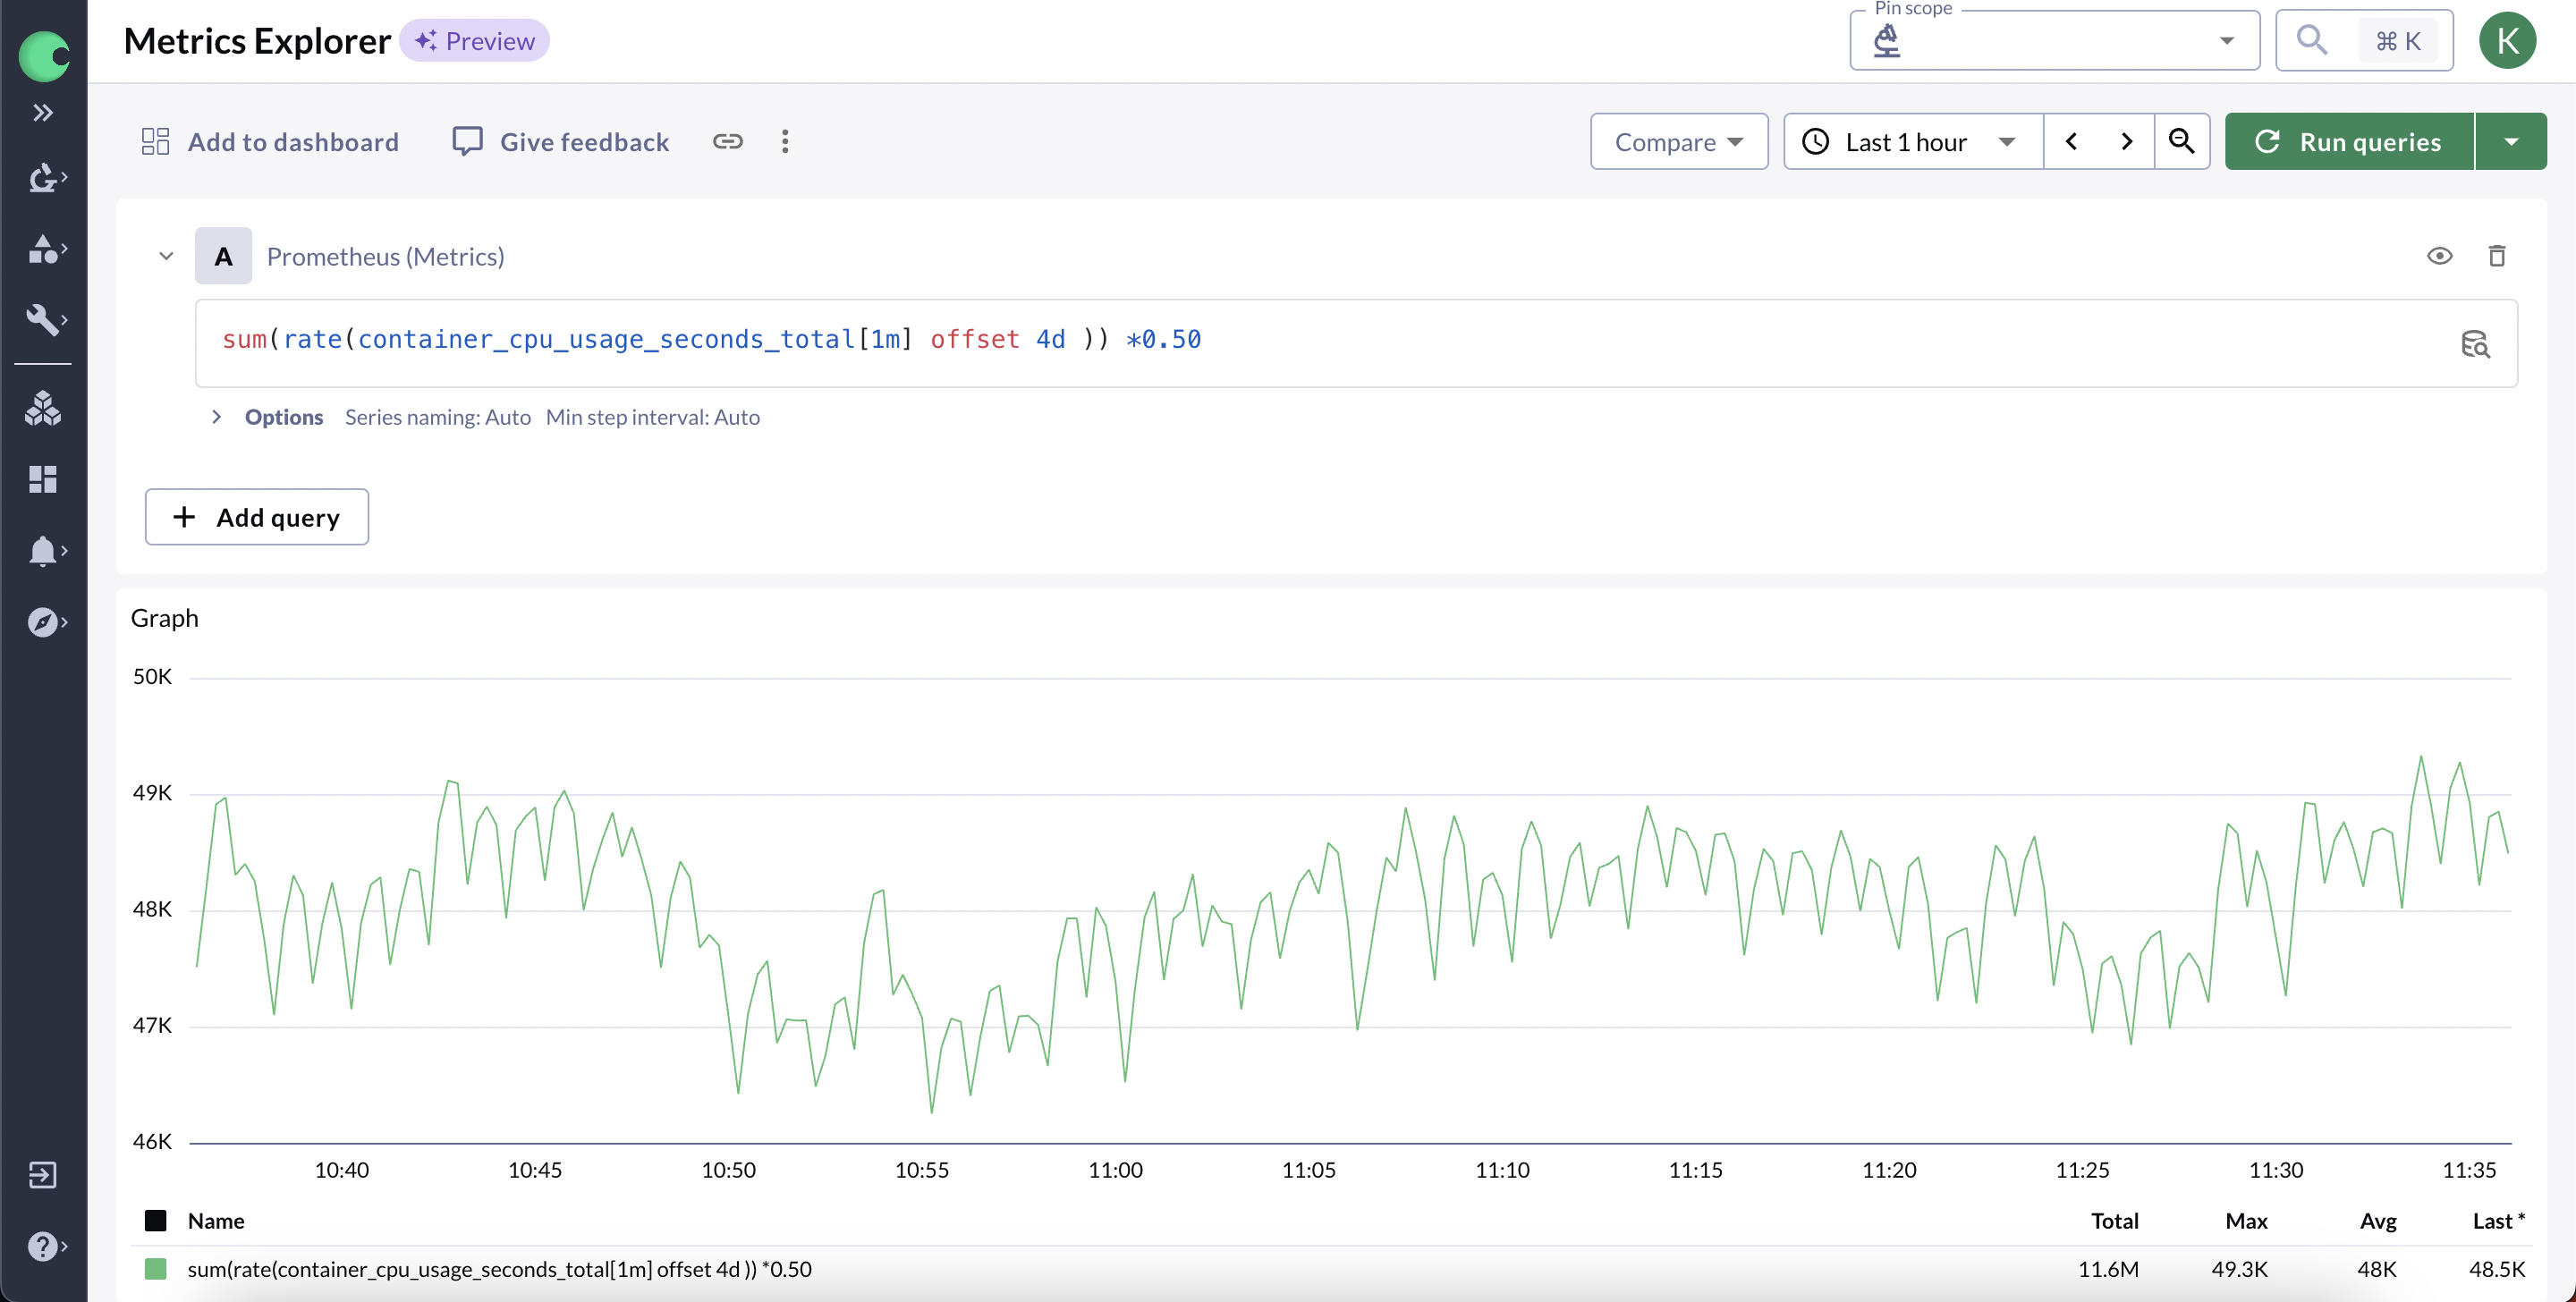
Metrics
Your observability heartbeat starts with metrics. You need to ingest and query high cardinality metrics generated by your containerized infrastructure, microservices applications, and business services.
Generate near instantaneous alerts that go to the relevant teams with all the context they need to rapidly triage the incident. With lightning fast queries and dashboards, teams get everything they need to remediate issues before your customers feel a thing.
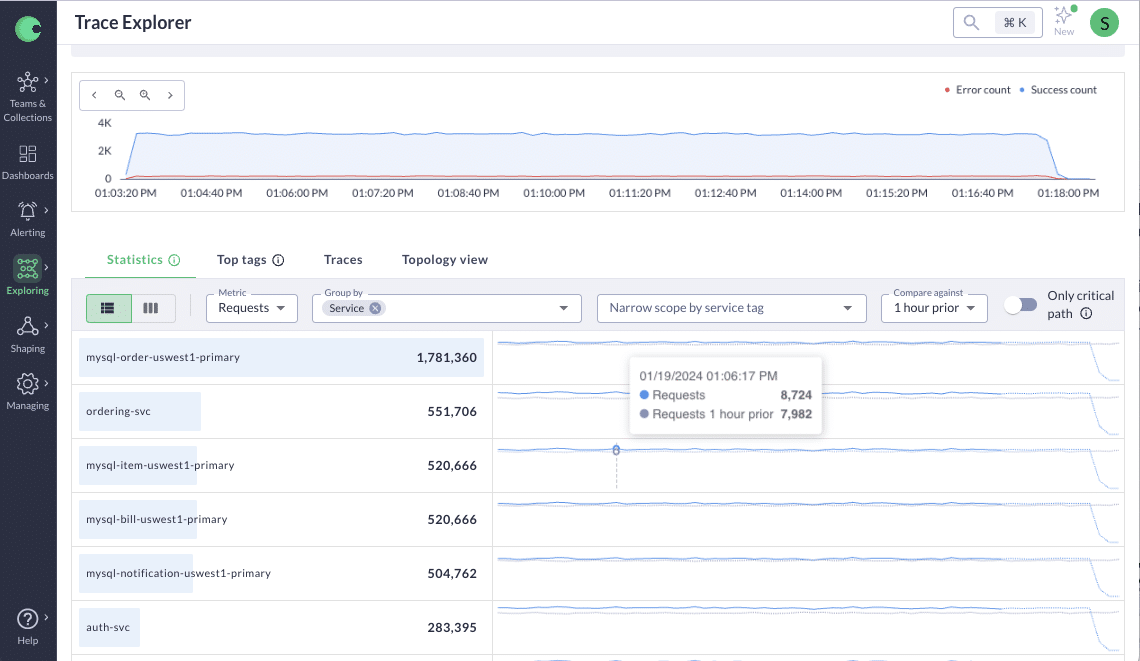
Distributed Tracing
Ingest distributed traces at scale seamlessly along metrics. With the ability to capture, store and analyze every single distributed trace (even at scale), you are able to make more accurate decisions based on the full distributed trace data set.
Using functionality like intelligent aggregation and analysis to compare two sets of traces rather than individual spans, you can get better insights into the past, present, and future performance.
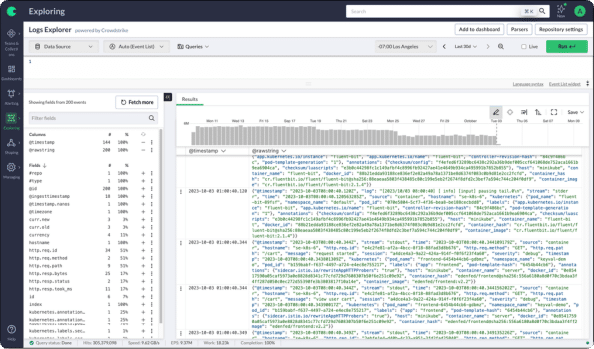
Logs
Empower your operations with Chronosphere Logs, designed for cloud-native complexities. Capture and manage vast data volumes with unmatched efficiency, ensuring every log needed is contributing to your observability.
Benefit from seamless integration and correlation across all data types, enabling full visibility and ultra-fast, index-free searches. Optimize performance and cost, maintaining robust scalability as your enterprise grows, and make informed, agile decisions for resilient, uninterrupted service delivery.
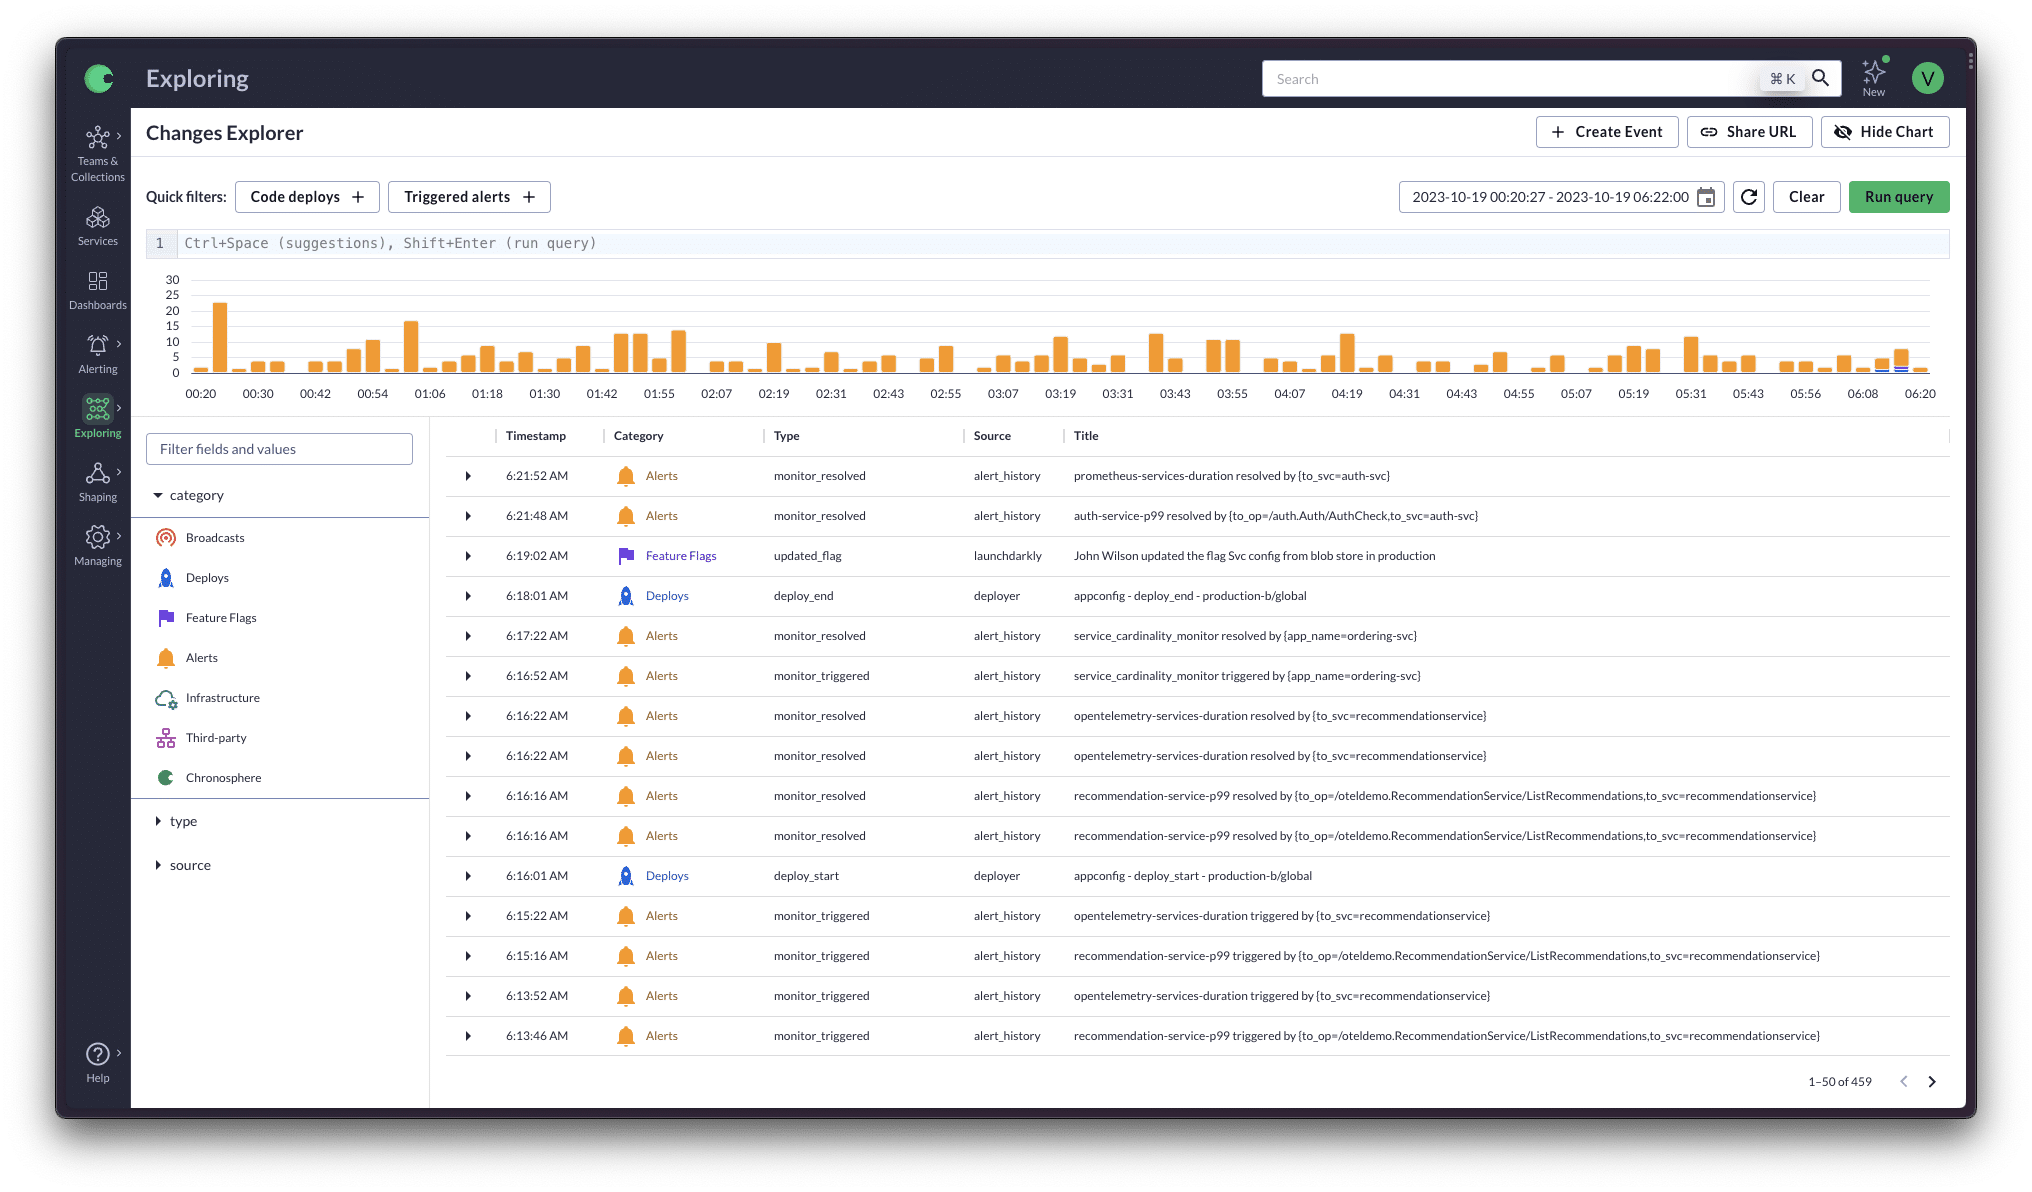
Events
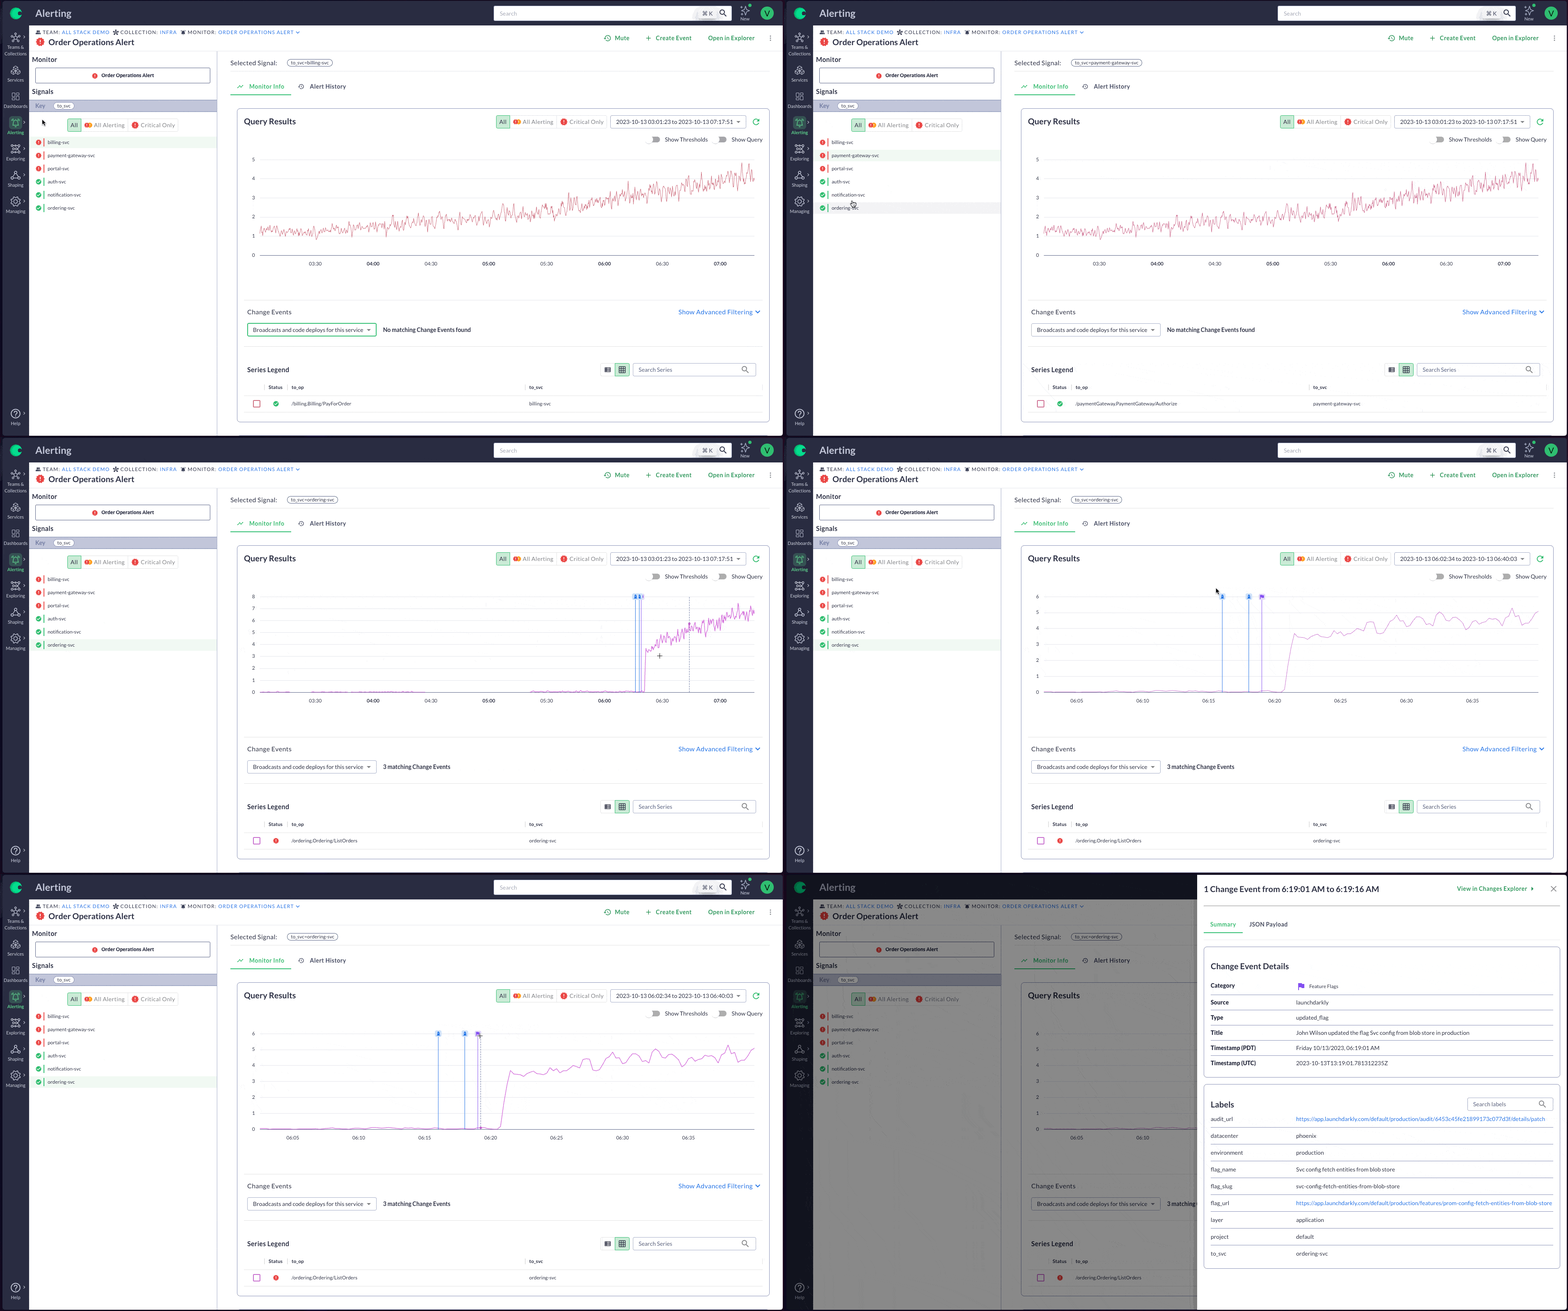
Events are specifically designed to empower your developers to rapidly orient themselves on what recent change may have caused an incident. With the ever-growing complexity in modern, cloud native development environments, tracking changes, correlating alerts, and auditing modifications can become overwhelming.
Change Event Tracking turns these challenges into seamless operations. It offers a cohesive set of capabilities that not only centralize the visibility of changes but also enable rapid correlation and auditability.
Test Drive Chronosphere Lens
Key Capabilities
Observability that thinks like a developer
The current landscape of observability tools often falls short of mirroring the “you build, you run it” philosophy, which is intrinsic to a developer’s workflow. Chronosphere Lens provides developers access to a platform that resonates with their mental models and abstracts away the noise of raw data.
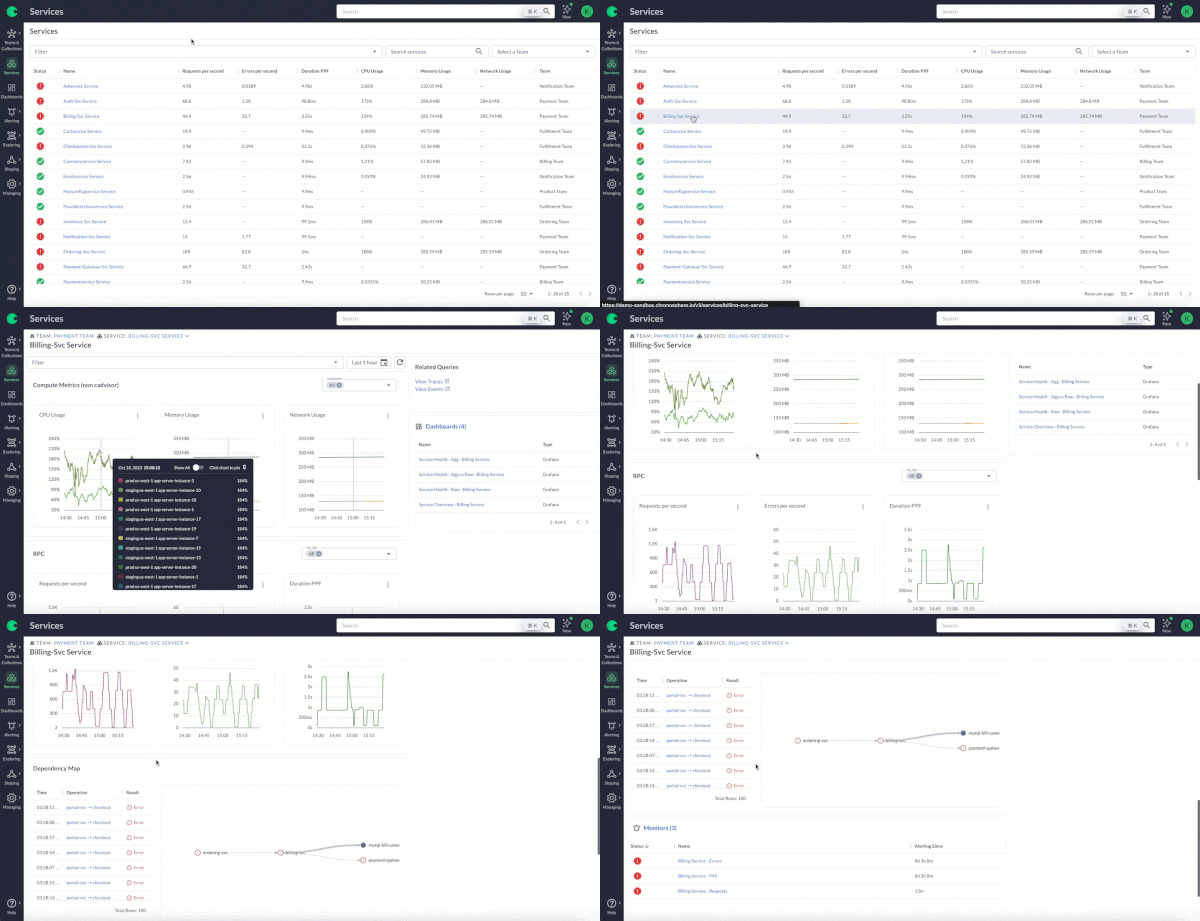
Chronosphere dynamically generates service-centric views that allow developers to intuitively navigate the complex landscapes of their systems.
Open Source Compatible
With Chronosphere, you can harness the power of open source by importing community-generated Grafana dashboards into Chronosphere. Whether you need to monitor Kubernetes clusters and pods, track SLO burndown, keep tabs on Redis, ElasticSearch, or Postgres, there are thousands of community dashboards that you can easily import.
In addition, Chronosphere makes open source query languages like PromQL easier to understand with QueryBuilder, a visual query assistant that helps build, debug, or optimize your PromQL queries.
Context linking
Without sufficient context, developers struggle to see the full picture, navigating through a maze of dashboards and tools that fail to speak the language of their cloud-native environment and applications effectively.
Chronosphere brings context into every step of the break-fix workflow from change events in context of alerts, metrics, and traces to global context filters that allow users to zoom in to a specific service or issue.
All telemetry signals are contextually linked to each other, allowing developers to seamlessly jump between them as they need.

