


Platform engineering and good observability go hand in hand
As we have seen, good observability practices can increase the stability of a system by allowing the team supporting it to become aware of, diagnose, and fix issues quickly. It is also a powerful way to show value in any effort, proving to business stakeholders that any effort an engineering team takes can return value (customer-facing or not.)
This is because data can trump opinions on what is going well and what is not. True observability is more than just data and telemetry; it provides insights.
To concretely define our usage of the term “observability: Observability is determining and explaining a software system’s internal state and usefulness by gaining insight from its output data.
Gaining insights
To gain insight from the observability data of any software system, we need more than just the metrics output by the infrastructure and applications running in the system. We should collect three distinct types of data: metrics, logs, and traces.
Most systems will output some of these by default, and we should also aim to collect custom telemetry data as defined by our ODD practices. To know how we can get the most compelling insights, we should understand how we describe these telemetry types and how they can be used. In the diagram below, we describe the three core components of observability and how they intersect.
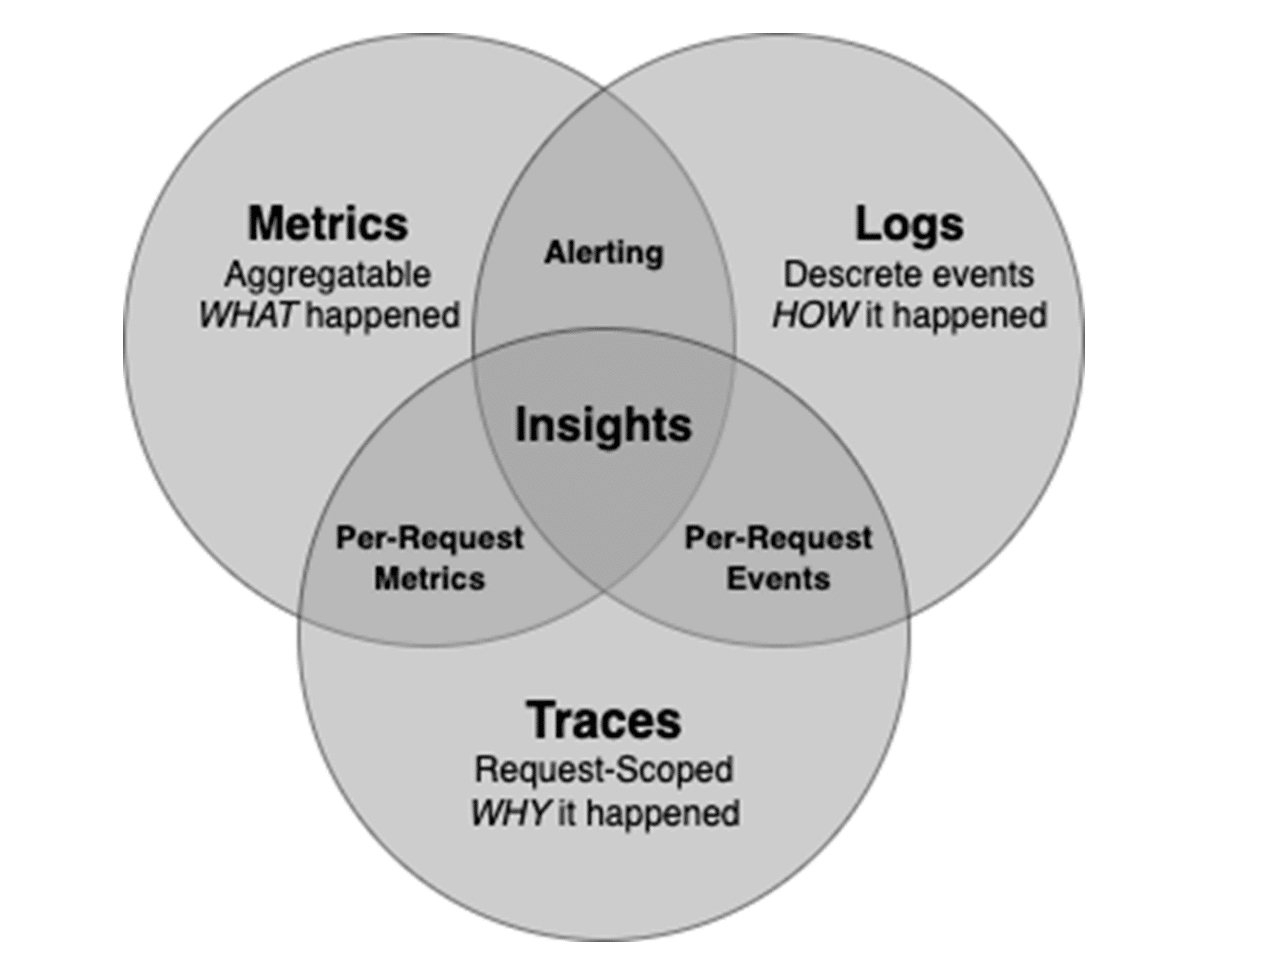
Caption: Components of Observability go beyond metrics to include logs and traces. These can be used to show what is happening in the system, why it happened, and how it got into its current state. Alerting and Logs are typically used to generate alerts, but correlating all three types can result in powerful insights into the system state.
Observability components
Metrics
Metrics are the point-in-time telemetry points typically aggregated over time and produced in high volume. When diagnosing a problem, the metrics will tell you what happened. This can be very useful for generating alerts if an unexpected event happens, such as an overloaded server or running out of capacity. Some examples include:
- CPU and Memory
- Usage HTTP
- Errors Disk Capacity
Logs
Once you know about an event, you’ll likely need to find out how the system got into that state. This is where logs become helpful. Logs are discrete events that happen as a process is executed and can be queried individually or as a set over time, but usually won’t be aggregated.
That means that combining the logs from multiple events in a summarized form has diminishing value as opposed to looking at it discretely. Data in logs can also be used for alerting when combined with metrics. Some examples include:
- A function was entered or completed
- A request was sent to an external API, and a result was received
- The firewall blocked a network packet because of the source IP
Traces
Knowing how a system got into a particular state is sometimes enough. Still, in modern systems, processes will usually cross multiple boundaries of applications and APIs as they are executed. When something happens there, we often need to know why an event occurred, and traces can help.
Traces are events scoped to an individual request across multiple processes, and a correlation ID is used to join trace information across systems. An example trace could be: Request received by the webserver -> Authentication token verified -> Request made to API -> Event sent to message bus -> etc….
Insights
To get powerful insights from a system, we need to correlate all three of these telemetry types. For example, imagine that an alert is received indicating that a significant number of HTTP errors from a cart checkout have been returned to multiple users of your website for the last 20 minutes. For example, you are responsible for building a cart checkout feature and rush to find out what went wrong. You now query logs from the checkout system over the period the error codes were being returned and find out that you got an invalid response from another system that calculates the tax of an order. Still, it’s unclear why that would happen.
Now you can use the correlationID on one of those requests to trace the functions that were called and find out that six functions down a nested stack of calls, a process ran out of memory because the node it was running on didn’t scale when it was supposed to.
Without making these correlations quickly, you may have been debugging for hours only to discover it was an infrastructure issue!
Use cases for observability
Use cases for observability beyond applications. As an engineer, it’s natural to consider observability regarding the telemetry data and insights needed to monitor and diagnose the infrastructure and applications your team supports. To ensure that your observability practices are most effective, you should also recognize that this data and the insights it can produce are helpful to many stakeholders across the business.
Anti-patterns
One of the common anti-patterns we have seen in the industry is the singular focus on application observability. In our opinion, this is a significant reason why the eventual experience for the end-users of your services is suboptimal.
Instead, we strongly recommend looking at observability through the eight distinct but related lenses to ensure a better outcome.
Let us now look at how our fictional company, PETech, understood the value of an expanded focus. Their initial focus, like many of the other organizations we know, was singularly on application performance. This helped their engineering teams troubleshoot the application issues but pretty soon they realized this wasn’t enough.
The customer complaints continued and the executive leadership was baffled to see that the much vaunted observability approach did not yield the results they were looking for — customer satisfaction about their products.
After a deeper dive, the team recognized a critical gap in their approach. They found the following problems:
- Third-party tools used across the development and delivery ecosystem weren’t observed adequately.
- There was overnight processing of some operational tasks that had to run as scheduled tasks to do the processing. These were run as cloud services, which, when failed, provided significant impact on the customer’s experiences.
- There was the silly problem that some of the disks were filling up on two of the production servers, which the monitoring always caught after the fact, creating an annoying customer experience.
- The cybersecurity team had a completely different process that was not integrated into the central observability framework where the release management and senior leadership would hear about the security breaches. This was starting to have a reputation and credibility impact for the senior leadership.
- PETech found that conversion rates from first time users to repeat users were dropping significantly. However, they found this during their Monday morning review calls, by which time they had lost half the battle.
- By standard practice, CFO received cloud usage reports on a monthly basis showing significant overruns. Instead, she wished there was a way to have the developers and SREs adjust the cloud usage scaffolding on a real-time basis without having to have her team get involved.
- As PETech was expanding to the Europe region, obtaining specific feedback on how GDPR privacy regulations were reported on a daily basis, and ensuring compliance against that, was becoming a critical requirement.
In the image below we introduce the eight axes (seven listed above, in addition to application observability) that addressed each of the problems PETech encountered and we are sure you will too. Suppose you confine your observability efforts to just the applications and the infrastructure on which the applications run. In that case, you will miss the big-picture view of your eventual goal – an ideal customer experience while running your systems in the most cost-optimal manner.
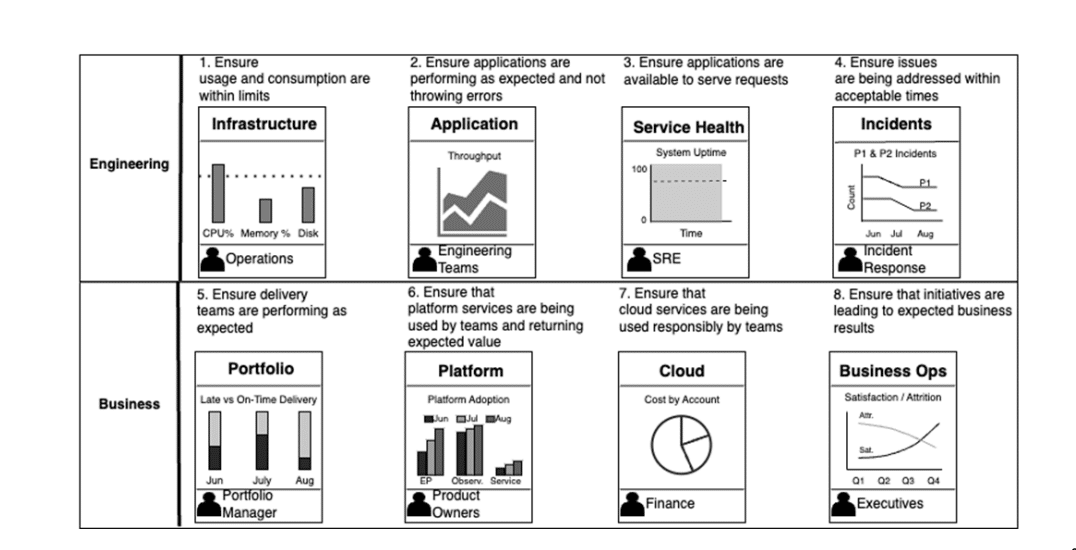
The image above illustrates how observability data can be described across multiple engineering and business operations facets. Users and use cases are more than developers and operations personnel responsible for running the system. Stakeholders, security, and governance also have questions the data can answer.
Whitepaper: Balancing Cardinality and Cost
Learn how to control costs while managing high-cardinality data in your observability strategy
Connecting engineering facets with the right data
Observability data can be described across multiple engineering and business operations facets. Users and use cases are more than developers and operations personnel responsible for running the system. Stakeholders, security, and governance also have questions the data can answer.
Observability can be described across eight facets, and recognizing them can inform the types of telemetry that should be produced. This data can be queried and aggregated across these facets for insights to drive engineering and business strategy decisions. Here are some examples of how engineering and business stakeholders can use each aspect of observability; you can likely think of many more.
Infrastructure
Telemetry on the hardware (physical or virtual) that runs the systems can generate insights such as usage, consumption, and failures. It is typically used by operations and DevOps personnel but is also helpful to system architects to ensure right-sizing.
Application
Telemetry on running applications. Engineering teams can use this to ensure the health of software systems and diagnose issues. Still, it is also valuable for product managers to determine whether new features are being used as expected or if a feature should be prioritized to develop a better user experience. Service Health is data that indicates whether a service (which may consist of many applications and infrastructure resources) is running well. SRE teams typically use it to optimize runtimes and ensure stability. Product owners can also use it to prioritize stability issues on a backlog over new feature development.
Incidents
Data from ticketing systems or incident response workflows. Incident response usually uses incidents to measure team effectiveness. Engineering leaders can also use incidents to evaluate the success of a platform initiative designed to decrease incident response times.
Portfolio
Data to indicate effectiveness on portfolio delivery across an engineering function. This could include telemetry around deployment frequency, on-time feature delivery, or user story cycle times aggregated across teams. Team leads use this data to monitor effectiveness, and managers use it to identify bottlenecks and cross-team dependencies to inform team structure decisions.
Platform
Data will indicate the platform’s usage and health. This could include team adoption rates or how often platform services are used. Product managers use it to determine backlog priorities, and the business can also use it to value the ROI of a platform initiative.
Cloud
Data on cloud usage and cost. Architects use it to meet runtime cost targets, and finance departments can also use it to calculate ROI on cloud costs across teams and environments. Business Operations: Data on systems across business capabilities that indicate business value. Used by product owners to ensure that newly released features return expected ROI, and also used by leaders to monitor the health of the business
Stay tuned for our next installment when we tackle what good observability looks like.
Editor’s note: This article is an excerpt from the Manning MEAP (Manning Early Access Program) book, “Effective Platform Engineering.” In MEAP, you read a book chapter by chapter while it’s being written and get the final eBook as soon as it’s finished.
O’Reilly eBook: Cloud Native Observability
Master cloud native observability. Download O’Reilly’s Cloud Native Observability eBook now!