
Introducing Logs Usage
Yesterday, we announced Chronosphere Logs 2.0. The centerpiece of this release is our Logs Usage feature, which we built after hearing the same problem from hundreds of observability teams: it’s difficult to know which log data to keep and which to reduce or remove.
This creates a common scenario: teams either keep everything and face escalating costs, or remove data and risk losing something critical during an incident. The Logs Usage feature addresses this by showing how your teams actually use log data, enabling data-driven decisions about what to reduce.
The core problem we are solving
Most engineering teams struggle with log data reduction because they lack visibility into usage patterns. Without knowing which logs are actively queried or used in dashboards, teams default to keeping everything. This leads to predictable outcomes: logging costs grow exponentially, query performance degrades, and the signal-to-noise ratio decreases.
How Logs Usage works
Pattern recognition and clustering
The feature starts by analyzing every incoming log entry. It groups logs into patterns based on similarities, capturing the structure of the log while abstracting variable elements.
For example, these logs would be grouped into the same pattern:
2024-06-11 10:23:45 INFO User 12345 logged in from 192.168.1.100
2024-06-11 10:24:12 INFO User 67890 logged in from 10.0.0.50
Chronosphere recognizes the shared structure (timestamp, log level, message format) while treating user IDs and IP addresses as variables. This clustering enables Usage Analysis at the right granularity – focusing on log types rather than individual entries.
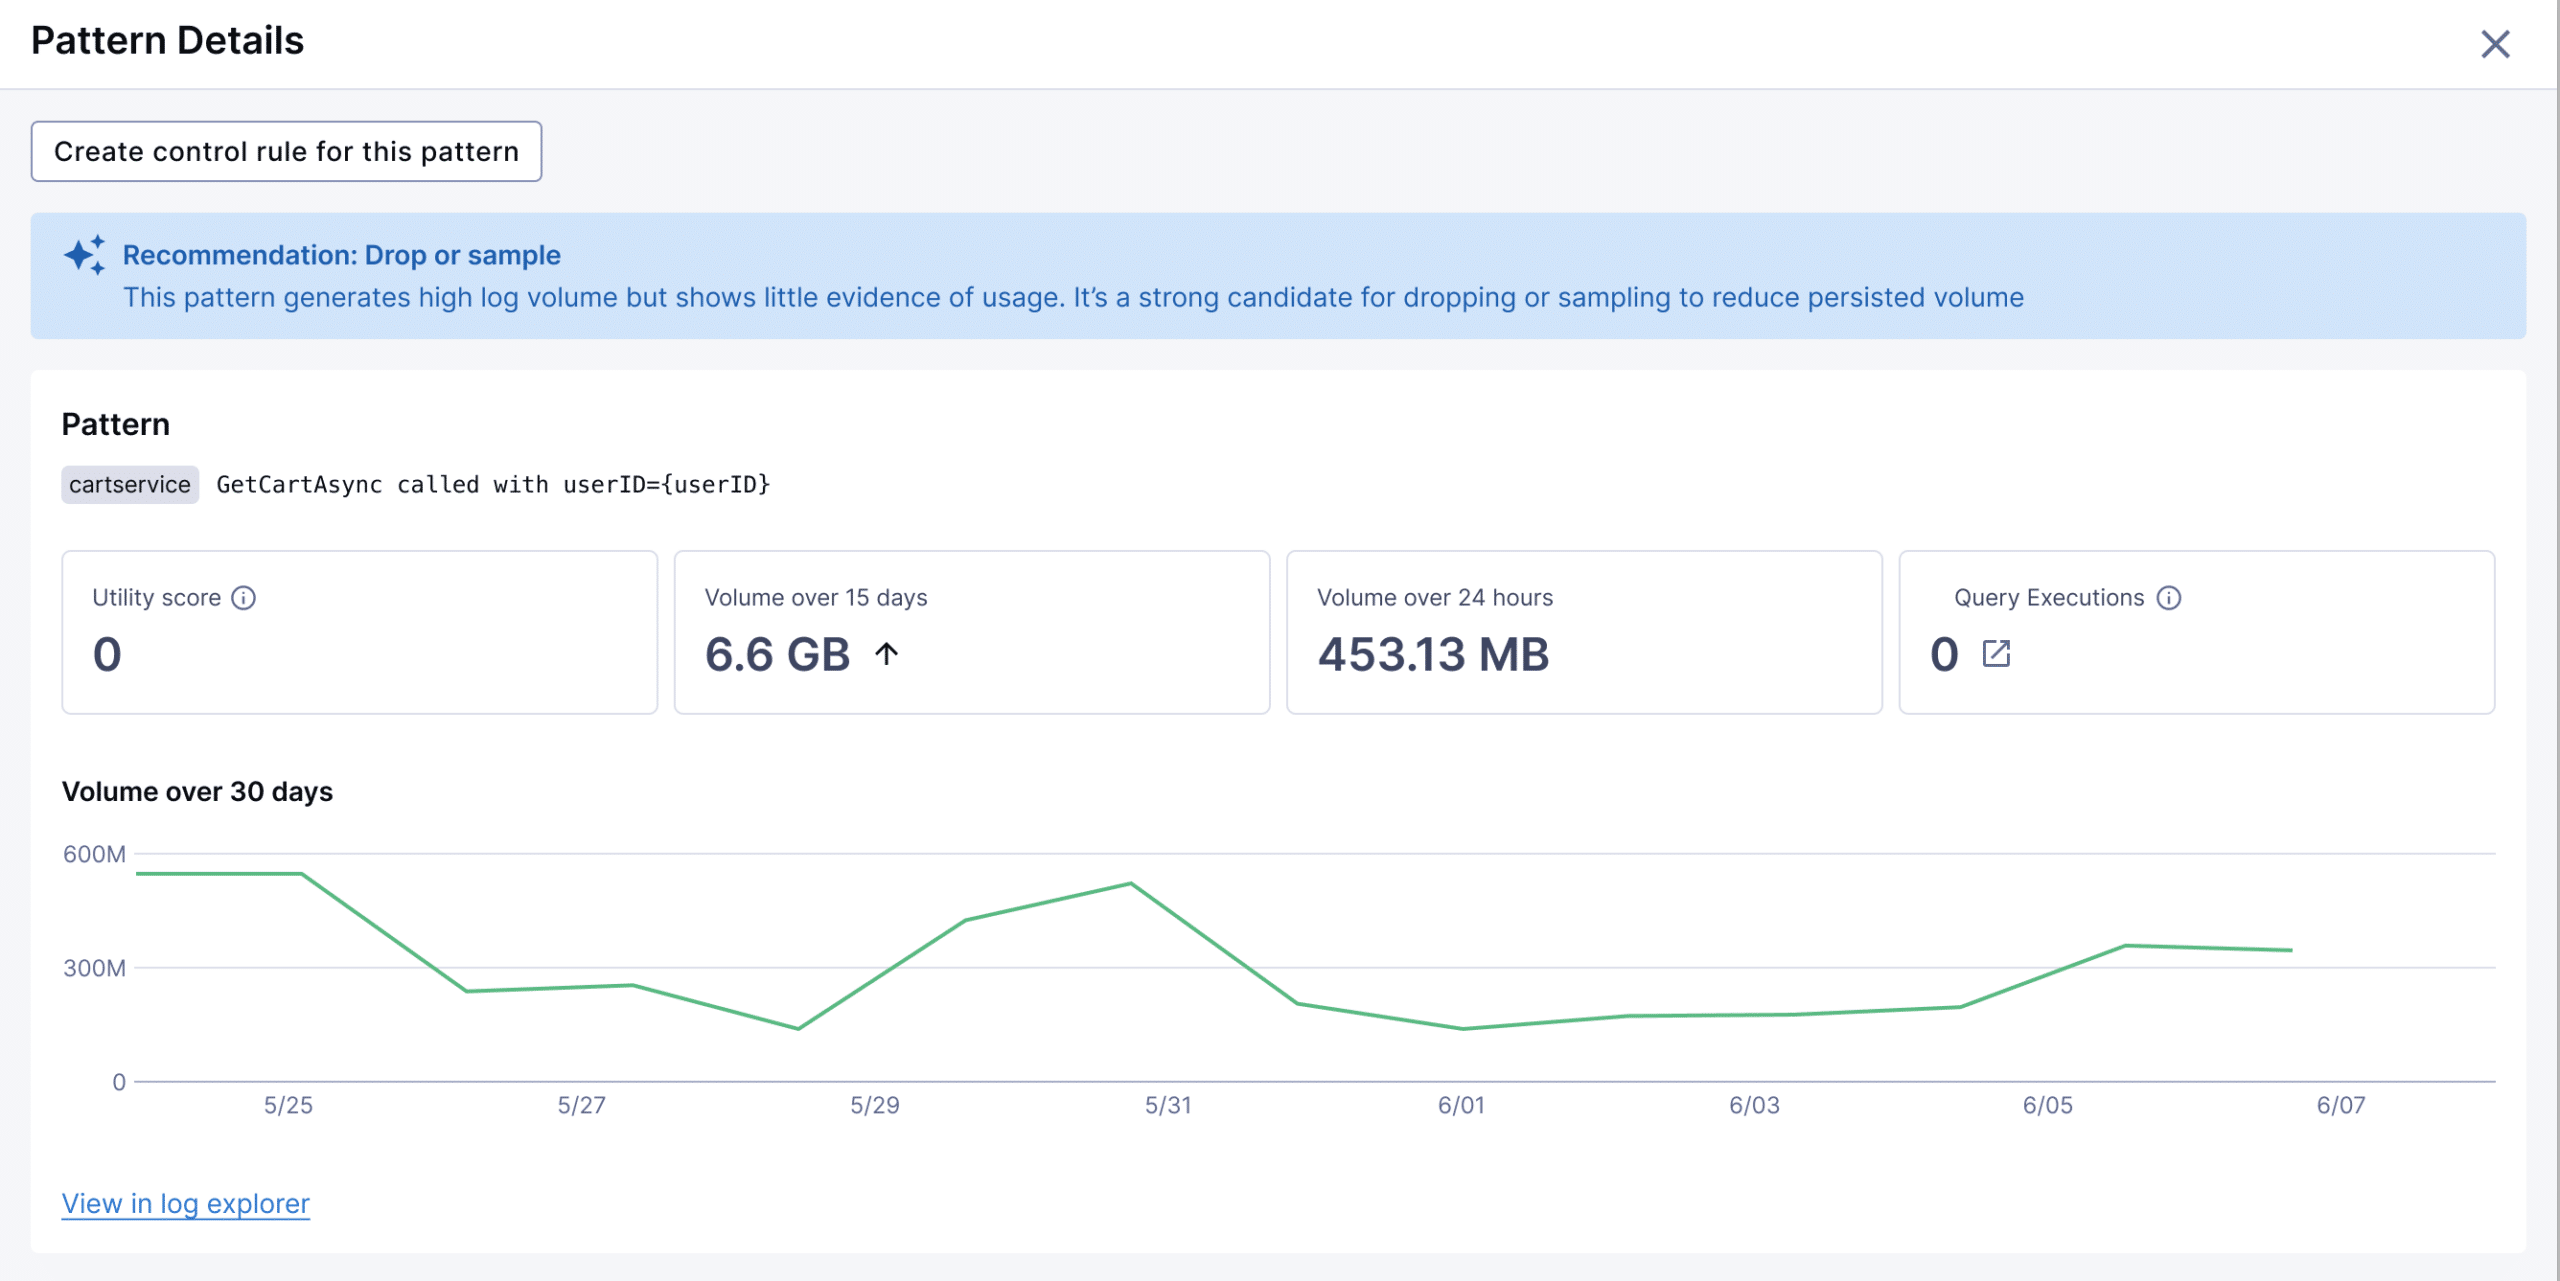
Utility scoring
Once patterns are identified, the system assigns each a Utility Score based on actual usage by your engineering teams. The scoring considers two factors:
- Logs Explorer execution: Does this pattern appear in Logs Explorer searches? This includes both simple text searches and complex filter queries that engineers use during investigations.
- Dashboard execution: Does this pattern power dashboard visualizations? This indicates ongoing monitoring value rather than ad-hoc investigation needs.
Control Rules recommendations
Based on utility scores, the system generates specific recommendations:
- High-utility patterns: Preserve as-is. These appear frequently in both queries and dashboards.
- Zero-utility patterns: Drop or sample, with archival to object storage for compliance. These never appear in queries or dashboards.
- Dashboard-only patterns: Convert to metrics. These power monitoring dashboards, but aren’t searched directly.
Volume analysis
The feature tracks data volume per pattern over 15-day rolling windows. This temporal view helps teams:
- Anticipate growth: Identify trending patterns before they impact budgets
- Detect spikes: Spot sudden volume increases that might indicate issues
- Plan capacity: Use historical data to forecast storage and processing needs
A practical example
Here’s how this plays out in practice. A platform team receives an alert about increased log volume overnight. Investigation shows a new service was deployed with verbose logging enabled.
The service is generating a high volume of HTTP 2xx logs. But, Usage Analysis shows they have a utility score of zero – no engineer has searched this data, and it doesn’t appear in any dashboards.
The recommendation is clear: implement sampling for this pattern and route the raw data to Google Cloud Storage. The team can preserve a small percentage to understand what successful requests look like, while routing the majority to object storage.
Scanning other high-volume patterns reveals additional opportunities. HTTP 4xx error logs have high volume, but only appear in dashboard queries for error rate monitoring. The recommendation is to convert these to metrics and route the raw data to Google Cloud Storage. This action maintains the monitoring capability while dramatically reducing storage costs.
Explore Chronosphere's Log Feature
Learn how Chronosphere Logs offers seamless integration with metrics and traces, providing a unified platform and an enhanced user experience
What’s the result of leveraging Logs Usage?
Teams using this approach typically see:
- Immediate insight into low value data: Users quickly understand what data they need and what data they don’t.
- Rapid cost reduction: Our early customers have saved 52% on logging costs.
- Improved query performance: Smaller data volumes mean faster searches during incidents.
- Better signal clarity: Removing noise makes genuine issues more apparent.
Getting Started
The Logs Usage feature is available in Chronosphere now. Teams typically start by:
- Reviewing utility scores for their highest-volume patterns
- Implementing recommended control rules for low- or no-utility data
The feature provides the data needed to make informed decisions about log reduction, moving teams from reactive crisis management to proactive optimization.
This represents a shift from choosing between comprehensive logging and budget control to having both: comprehensive observability with right-sized costs based on actual usage patterns.
Explore Chronosphere's Log Feature
Learn how Chronosphere Logs offers seamless integration with metrics and traces, providing a unified platform and an enhanced user experience.