


When it comes to observability, teams want to work smarter, not harder. But they need the right tools to more effectively and efficiently monitor and troubleshoot applications. Without them, it’s impossible to run cloud native architecture.
Metrics, logs, and traces are just components of observability. Tools should help teams focus on the three phases of observability; without the ability to know, triage, and understand the data a cloud native environment produces, it becomes harder to locate and remediate incidents.
A Market Insight Report from 451 Research, part of S&P Global Market Intelligence, Chronosphere aims to improve team productivity and manage usage on its cloud-native observability platform outlines just how organizations can benefit from the latest features in observability tooling to detect and triage issues faster.
Here’s a look at the report’s specifics.
Why observability?
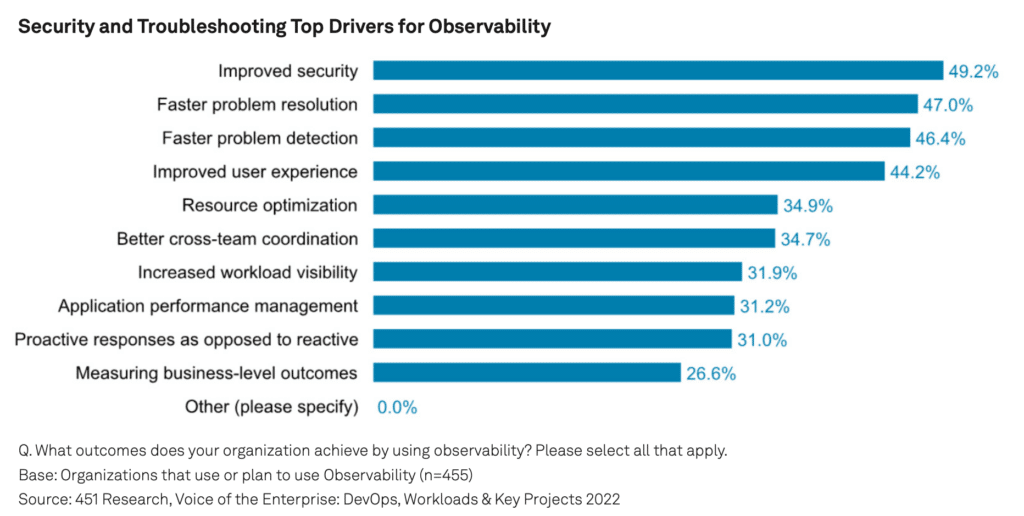
Faster problem resolution, faster problem detection, and improved user experience are the top three reasons that companies look to use observability solutions according to 451 Research’s recent Voice of the enterprise: DevOps, workloads & key projects 2022 report. As cloud native environments grow, observability is an essential management tool for an efficient and profitable business.
Engineering teams and managers must be able to know how well their workloads are running within the cloud, where their data is, and be proactive about any potential incidents.
The report’s author states, “Chronosphere is improving the efficiency of engineering teams and administrators and providing the capabilities to manage observability data growth and costs by allocating and monitoring observability data usage.”
Observability provides context for engineers. With the right data, engineers know how well their cloud native environments are running, the severity of every incident that shows up on their dashboards, and how to find the problem quickly to remediate it.
451 Research’s report highlights that “Chronosphere has added new workflow and data organization capabilities, query enhancements, trace metrics, and observability data usage management to its observability platform. The goal is aiding teams in being more effective and efficient in monitoring and troubleshooting applications and the associated infrastructure across teams. Overall, these are incremental but important enhancements.”
More detailed information helps with faster problem detection and resolution. Data from Chronosphere’s 2023 Cloud Native Observability Report: Overcoming Cloud Native Complexity states companies aim for an average target mean time to repair of 4.58 minutes, but actual mean time to repair can be around 7 hours and 48 minutes.
However, companies with a vendor-provided observability solution have the quickest repair times at 5 hours 47 mins, when compared to those with their own solution (8 hours 5 minutes), or companies with no cohesive observability approach (13 hours and 57 minutes). These numbers decrease even further for companies with a higher percentage of cloud native infrastructure adoption, according to Chronosphere.
Beyond the technical aspects, observability tools help reduce developer burnout. The less time that engineers spend on troubleshooting, the more they can spend on overall innovation. This is especially important as engineering higher ups are facing concerns around talent retention and skill development. Without the necessary tools, organizations can struggle to keep talent – which can hurt the bottom line and cloud native environment efficiency.
Chronosphere specific features for productivity
451 Research’s report details Chronosphere’s investment in data processing features, trace metrics, and data quotas.
Dashboard processing and trace metrics
“Pre-processing dashboard data improves query efficiency. This, paired with trace metrics, help engineers work more efficiently,” 451 Research states.
The platform’s Query Accelerator finds slow-loading dashboard queries and then pre-writes the aggregated data for the dashboard. Once the data is written, it searches for similar queries across the entire dashboard and returns the pre-aggregated time series for a faster user experience.
This feature helps users load large amounts of data without timing out or being unable to retrieve data. Furthermore, engineers can get better system performance without the need to manually identify similar queries that might load faster.
Trace metrics let Chronosphere users generate a metric data point based on a partial or full trace; this data point can then serve as the foundation for an alert and/or dashboard. Additional capabilities such as critical path, trace span logs, and topology view allow users to dive deeper into workflows and events to identify potential issues or performance bottlenecks – without manual correlation.
451 Research writes that “traces show the path (or route) through a microservices environment for a given call flow (or request flow or workflow). Trace metrics enable engineers to create a single metric that represents all or part of that call flow so users can create alerts and dashboards for visibility into the parts of that flow that matter most to the business.”
Data quotas
Observability data quotas are another way that users can manage data – and most importantly – avoid data explosions. Without quotas, companies may find themselves unable to manage data, which increases cloud costs and bloats storage capacity.
Users can set data storage quotas and also apply limits to certain services or teams. Both of these capabilities help keep systems stable and minimize the consequences of a data explosion, should one occur.
Data quota options can also prioritize what data the system keeps or drops when rate limits are active. With quota alerts, teams can also identify data spikes and figure out ways to redirect or reduce data traffic before extra costs happen or performance degrades.
Chronosphere’s features can help engineers see all available data, as well as filter with any metrics labels to see what data drives the highest amount of traffic. With usage metrics, users can see any usage trends and break down metrics traffic by team. This visibility helps engineers decide if they should take action when a specific system starts to hit the upper limit for metrics traffic.
For example, the report states, “high-value applications should be prioritized for real-time and historical analysis over lower-priority applications, but without a way to manage their observability data allocation, lower-priority usage may consume a disproportionate amount of the licensed capacity.”
With the ability to set quotas and get data growth alerts, engineers can spend less time corralling data and reduce the number of affected services for applications.
Investment in Prometheus
Within the observability space, Chronosphere donated PromLens to the Prometheus foundation. This helps Prometheus users query faster and reduce the learning curve associated with the query language.
PromLens offers capabilities for users to edit more confidently, visually create and modify PromWL queries, debug queries and visualize sub-expressions, x-ray data, and view common query patterns.
“Working with Chronosphere, we’re reaching our goal of making PromLens open source. We share a mission to remove needless complexity and frustration from querying metrics, and this donation will go a long way towards making this a reality for Prometheus users,” said Julius Volz, founder of PromLabs and Prometheus creator in a joint announcement with Chronosphere.
The report’s author notes that “this donation shows the company’s commitment to open source and will lower a barrier for enterprises currently using Prometheus but evaluating Chronosphere.”
Redefining observability and improving productivity
Chronosphere’s platform is designed to make it easier for engineering teams to troubleshoot cloud native infrastructure without increasing costs, unusable data, and poor user experience.
451 Research’s report confirms that “logs, metrics and traces are merely elements, not outcomes: actionable intelligence is composed through the analysis of these elements. Observability vendors aim to empower developers, site reliability engineers, operations and business analysts by providing answers to questions that can be asked by exploring data.”
Download the full report to see how teams can use Chronosphere to improve team productivity and reduce mean time to repair.
- 451 Research, Mike Fratto, “Chronosphere aims to improve team productivity and manage usage on its cloud-native observability platform,” Nov 2022.
- 451 Research, Jay Lyman, “Voice of the enterprise: DevOps, workloads & key projects 2022,” Jul 2022.


