Many of us cobble this knowledge together from whatever vendor or ecosystem we were first introduced to and whatever is a part of your current company’s observability solutions.
Even within the same company there could be several different opinionated platforms, types of telemetry and data formats in place making it even more challenging to wrap your head around what observability means for you and your applications.
Though no matter what tooling is in place, there are still observability fundamentals that developers should know. That’s why I’ve put together a primer on the different telemetry types, when to use them, how to understand the data journey, and what to look for in time series charts.
Let’s get started and dive in!
What contributes to observability knowledge gaps?
Lack of training isn’t the only factor contributing to this knowledge gap, common reasons include:
Relying solely on automatic defaults: Auto-instrumentation and out-of-the-box (OOTB) dashboards and monitors bring a truckload of data but if you don’t explore it proactively you don’t understand what’s there or why. You probably also don’t understand how/where it gets emitted or how to modify it so you stick with defaults that aren’t tuned for your system
Going all-in on one type of telemetry: If your organization has strong support for one type of telemetry, such as logs, it’s natural that you would log everything because that’s the most accessible telemetry option. Identifying what you want to understand or measure before instrumenting can help you choose the most appropriate type of telemetry.
Hidden/Invisible post-processing: it isn’t enough to be able to emit this data. What processing is done on telemetry after you instrument at the code level? Aggregations, drops, filters, automatic metadata attachments?
Missing module in onboarding: maybe your company documentation covers where to find charts and monitors but doesn’t cover the specific adaptations of how your company uses XYZ tool meaning you can’t rely on the vendor documentation
Fear of missing signals: many developers I’ve worked with trusted the telemetry that came before them and would only add to monitoring, never take away because “what if that alert was really important for some unknown reason to us and we missed an outage?” This leads to badly tuned monitors, oh so many outdated dashboards to scroll past, and an ocean of telemetry to wade through.
Tool sprawl: there are multitudes of instrumentation libraries and formats both open and closed source with their own query languages and with many companies having multiple observability tools it can be like whiplash to page between tabs with vastly different UX, models, and siloed views of the system.
Understanding the types of telemetry and how they relate to each other lets you make smarter choices when you instrument code; better know the journey telemetry takes from your application to an observability backend so you know any transformations that happen; and more successfully interpret time series charts that power alerts, dashboard charts, and ad-hoc query visualizations.
1. Understanding Telemetry Types
You likely have come across the term “three pillars of observability” in the wild. Unfortunately the pillars have done more to hinder than help folks. Categorizing telemetry into either metrics, traces, or logs can leave you with the impression that each pillar is isolated and distinct — which couldn’t be further from the truth. The reality is the boundaries between those three types is much blurrier. Clearing up this misconception will help you the most when it comes to adding or modifying instrumentation in your system.
Telemetry Types
There are four main telemetry types you’ll see in an application:
- Traces: Tracks the path a single request makes, applications emit a span for each significant operation in the workflow
- Logs: Tracks individual records of activity
- Metrics: Tracks a numeric measurement over time
- Events: Tracks information associated with a meaningful occurrence for a point in time
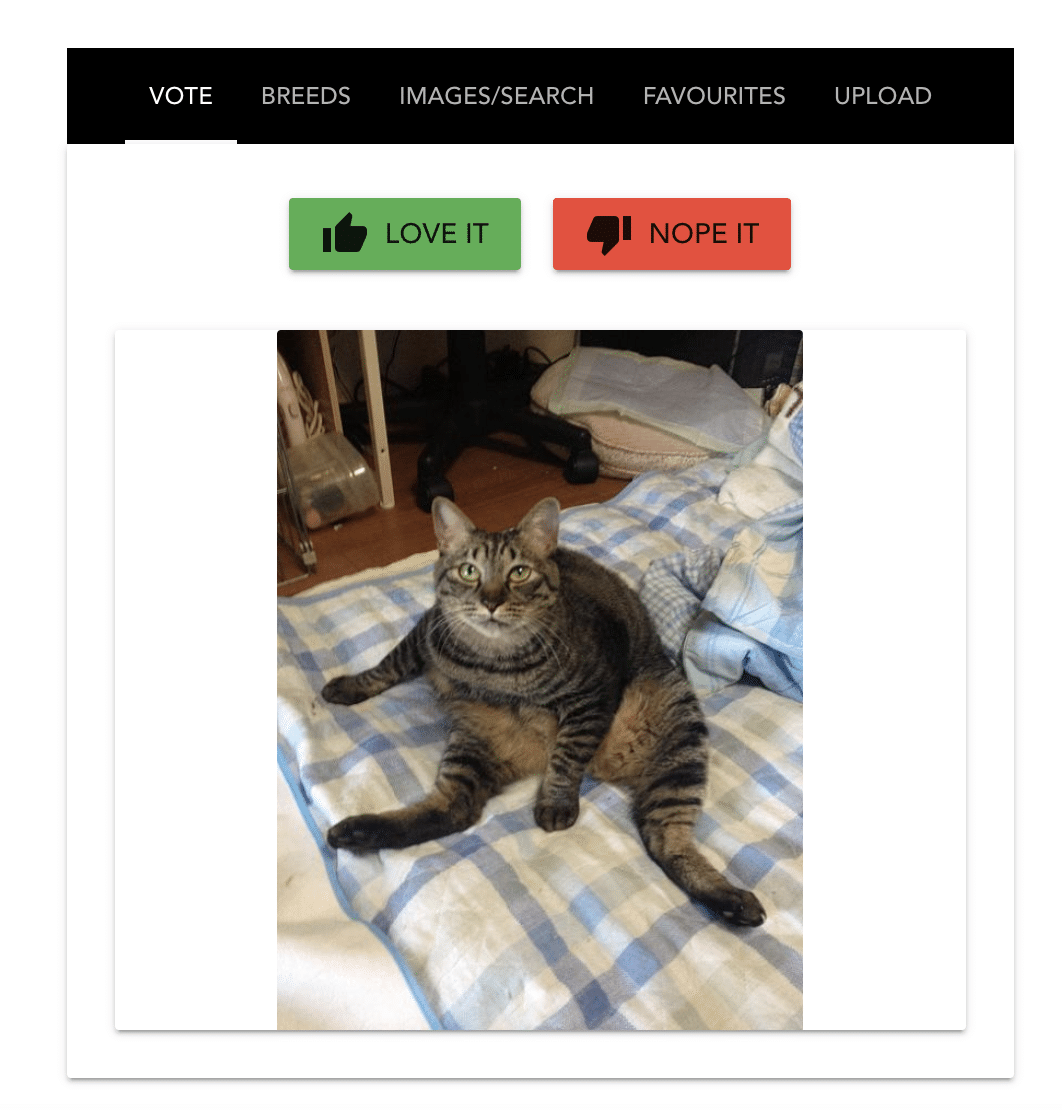
Let’s showcase how blurry these boundaries are between telemetry types. Say we want to monitor and observe the volume of requests flowing to your application, Cats as a Service, that shows a random image from the Cat API every time a user loads the page. It’ll help us demonstrate the different telemetry types.
Tracing Requests
You could trace this entire request workflow and send a span capturing the timing and metadata associated with the external call to the Cat API and any additional processing spent in your application. An example “root” span for this trace might look like this in textual form:
{

"name": "/",

"context": {

"trace_id": "0x12d7c5f5f3dd368dc7d0705ab47cd6f2",

"span_id": "0x77e58144932d5b8e",

"trace_state": "[]"

},

"kind": "SpanKind.SERVER",

"parent_id": null,

"start_time": "2023-08-21T00:13:31.541545Z",

"end_time": "2023-08-21T00:13:31.542622Z",

"status": {

"status_code": "UNSET"

},

"attributes": {

"http.method": "GET",

"http.server_name": "0.0.0.0",

"http.scheme": "http",

"net.host.port": 8000,

"http.host": "localhost:8001",

"http.target": "/",

"net.peer.ip": "10.88.0.7",

"http.user_agent": "Mozilla/5.0 (Macintosh; Intel Mac OS X 10_15_7) AppleWebKit/537.36 (HTML, like Gecko) Chrome/114.0.0.0 Safari/537.36",

"net.peer.port": 43184,

"http.flavor": "1.1",

"http.route": "/",

"http.status_code": 200

},

"events": [],

"links": [],

"resource": {

"attributes": {

"telemetry.sdk.language": "python",

"telemetry.sdk.name": "opentelemetry",

"telemetry.sdk.version": "1.18.0",

"service.name": "cats",

"telemetry.auto.version": "0.39b0"

},

"schema_url": ""

}

}
From here we can also derive a metric tracking request volume, increasing a counter every time we see a span matching this combination of http.route and service name. If you add the spanID and traceID to your logs — and unlock the ability to jump from a trace directly to the log line to dig into the details.
You can visually represent this trace in a waterfall diagram, or a topology map, which is like a mini architecture diagram showing each service. Traces contain similar metadata to the log, capturing the route, status code, method. What’s different is instead of a singular timestamp, there is a timestamp at the start (when we received the request) and at the end (when we’ve responded to the request). This lets us easily calculate duration by subtracting end time from start time!
Logging requests
You could write a logline for every request that comes in and capture the HTTP method, HTTP status, route, and timestamp. If using a popular framework or programming language, this level of visibility is often available out of the box. It’d look like this with the Cat API.
| Unstructured log | Structured log |
10.89.0.38 - - 09-08-2023 23:58 PM successfully responded to GET request on path /cat |
method=GET path=/ format=json status=200 time=2023-09-08T23:58:16Z ip=10.89.0.38 |
From here, you could derive a metric and start incrementing a counter every time there’s a log line that matches this format.
Counting requests with metrics
We can gather metrics from both logs and trace spans, but you can also directly instrument metrics. One way to do this is to track the volume of requests over time.
If you use a popular framework or programming language this level of visibility often comes out-of-the-box but you can adjust the labels to add more facets to slice and dice the data by such as method, status, or path. It’d look like:
| Metric name | Value | Labels |
cat_service_http_request_total |
1 | method: GETstatus: 200path: / |
Tracking change events
What about events? There’s a lot of debate about whether a structured log or a span is considered an event. As a telemetry type, events have the least amount of standardization or common understanding across developers and vendors.
In my personal opinion, events represent a point-in-time “significant thing that happened” representing some change in your system. This means I do not consider every piece of structured data with a timestamp an event. Events are what I turn to when asking “What’s changed?” whether it’s infrastructure related like autoscaling up or down, arising from a new application deployment or a feature flag getting flipped.
Consider the CrashLoopBackOff event in Kubernetes which indicates that a container in a Pod is stuck in a loop of crashing and being restarted. Failure to successfully launch my application is a “significant thing that happened” that I care about. Receiving and responding to an HTTP request is what I expect my application to do as a normal part of business. For me, I wouldn’t consider logs or spans associated with handling HTTP requests as events.
When to use what type of telemetry
There is no one-size-fits-all approach to instrumentation and the strategy you use depends on what your organization currently supports, or is willing to explore and experiment. There aren’t “good” or “bad” types of telemetry; each type plays a role in helping you understand application behavior.
But when do you use certain observability telemetry?
- Metrics power visualizations and alerting and can be derived from spans, traces, logs, and events.
- Logs, structured or unstructured, provide lots of detail about what an application is handling.
- Traces showcase the work your system did to fulfill a particular request. Knowing the strengths of each telemetry type can help you put all of them to work when investigating.
Take time to ask yourself these questions when you instrument code:
- How do you want to visualize and analyze the data?
- What instrumentation formats are currently supported by your organization?
- Open source such as Prometheus or OpenTelemetry?
- Vendor specific and/or proprietary?
- What out-of-the-box instrumentation comes with your language, framework, or company specific libraries by default?
- Is this data already exposed in another format (e.g. don’t add a metric when you can derive one from a log)?
- What fields/metadata would help you troubleshoot an issue?
- Labels like
customer_tier,customer_plan,account_typecan help understand groups that are affected by issues.
- Labels like
2. Follow the telemetry journey
Becoming familiar with the journey each signal takes from source omission through storage is important because there are several processing phases that happen along the way.
Transforming telemetry is necessary in cloud native environments where the sheer volume of telemetry is cost-prohibitive to store at 100% fidelity. This processing affects what you query, and knowing about the telemetry will help you accurately analyze charts and visualizations.
Knowing the journey your telemetry takes is critical if:
- Your current tooling only exposes this post-processing information to SREs in a hidden administrative panel.
- Your tasks include observability bill reduction and you need to understand what tactics you can use
- Your charts and queries are becoming slow to load and hindering your investigations and you’d like to improve the performance and experience
- You tracking different signals across multiple ecosystems/vendors when investigating an issue
Generate telemetry
Unsurprisingly, the step where you generate the telemetry kicks off this journey. No matter whether that’s an event indicating that a deploy failed, increasing a metric counting HTTP requests received, or a span tracking how much latency a call to an external API contributes to requests hitting a certain route. This is language and/or framework specific and is where you likely already have a good understanding.
Emit telemetry from your application
Depending on your observability solution’s philosophy and type of signal, this step could mean your application pushes the data out or there’s another component that fetches the data. Prometheus popularized a pull-based system which means Prometheus is responsible for polling your applications “/metrics” endpoint on a configurable interval. A push-based system means your application periodically publishes telemetry to a designated collection service or endpoint. Knowing whether you’re working with a push- or pull-based system can help you debug when data is missing or malfunctions.
Collect all types of telemetry
Now that you’ve collected telemetry data, you’ve got to send it somewhere. This is where a collector ingests (either by push or pull) telemetry from multiple components or multiple types of signals. It’s likely that your company runs a whole fleet of collectors to handle large volumes of telemetry. Telemetry that passes through these proxies moves onto the next step, Process, before being exported to storage.
Process and transform telemetry
While telemetry passes through a collector and before it is exported to be stored many processing stages could be taking place. Enhancements like adding tags such as cluster/region/team-owner or filtering out fields matching certain labels can happen to all telemetry types. Here are processing steps that are unique to each telemetry type:
- Metrics: This occurs primarily through aggregation either temporally, by changing the resolution, or spatially by grouping data using a subset of original dimensions. Both forms of aggregation can help with cost and efficiency when dealing with high volumes of telemetry.
- Traces: It’s cost-prohibitive to store 100% of system traces. The decision about how and when to discard traces is called sampling. You can sample upon span creation ( head based sampling), or after trace assembly (tail based sampling). The goal is to end up with a set of traces that represent the status quo and those that diverge from the norm for comparison and analysis.
- Logs: Frustratingly enough, log aggregation means something different than metric aggregation. For logs, it refers to the mechanism to centralize the collection and consolidation of logs across different components. Scrubbing personal identifiable information and sensitive data from logs is a major step, as is parsing timestamps and translating to a specific datetime format. For unstructured logs, there could be custom processing written to extract known fields and create structure.
Store your telemetry for future use
After all this processing, the data’s final form is sent to a datastore (or multiple datastores) and made available for you to query, analyze, visualize, and alert on. Depending on the signal type, there are efforts after a certain period of time (could be 1 month, 3 months, or 6 months) where you aggregate and store that data at a lower fidelity when it is less relevant.
For some of this data (logs are a special case for regulated industries), you may only retain it for a few weeks, months or years. Getting comfortable with the retention period for each type of telemetry configured for your organization can help you understand what’s available for investigation and at what fidelity when reviewing historical data.
3. Decipher time series graphs
Metrics are everywhere. You can emit them on their own or derive them from all the other telemetry types. Metric data is great for identifying trends, outliers, anomalies, and seasonality, all helpful clues when investigating “why did this alert fire?” Visualizations like line graphs, bar charts, or heat maps help us quickly extract insights from heaps of metric data versus reviewing the data in its raw numerical form.
It’s easy to fall into traps or shortcuts when reviewing a sea of graphs underpressure during an incident, especially if flipping between multiple observability tools with different visualizations or default time windows. That’s why it’s helpful to know what to look for.
What questions would you have if you saw this chart out of context?
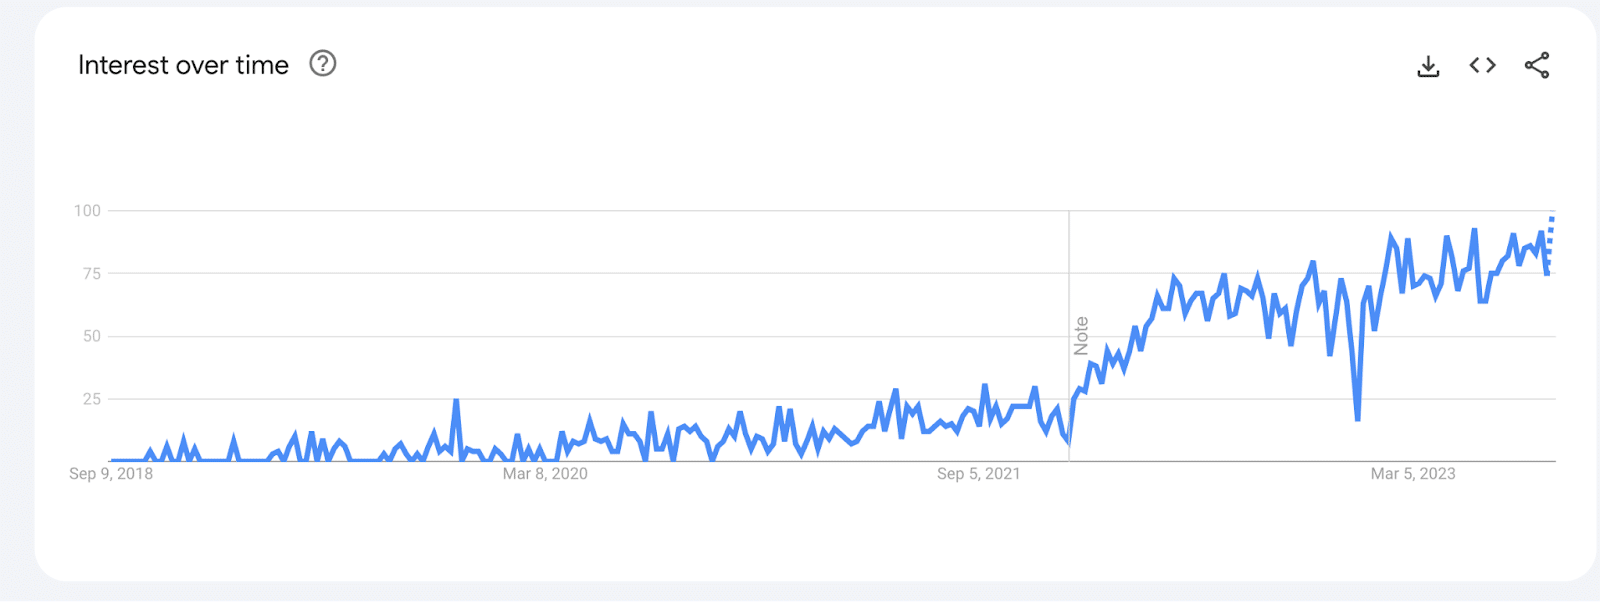
This chart from Google Trends shows the popularity of “OpenTelemetry” as a search term in the United States over the last 5 years.
The first question I asked myself was “what the heck do the units on the Y-axis represent?” and the second was “what’s the time window?” You should also be asking these questions whenever presented with a time series chart.
In this case, the Y-axis represents search interest relative to the highest point on the chart: 100 is peak popularity, 50 indicates the term is half as popular, and 0 means there wasn’t enough data. It can be easy to make assumptions when digging through a sea of charts but it is always worth double-checking the query, units, and time window.
I now know the graph represents interest over time on the y-axis and that the x-axis represents 5 years. I see that searches for “OpenTelemetry” is the most popular it’s ever been, with a weird dip before March of this year. Hovering over that data point shows it represents December 25-31 2022, which for the U.S. is when many offices close for end of year holiday breaks, so actually not that surprising!
This loop of visually taking in the chart, noticing trends or anomalies, and continually asking more questions about what you’re seeing is a process you’ll repeat until you dredge up some hypothesis or contributing factors.
When looking at time series chart, ask yourself:
- What is this query even asking for?
- What is the time window? What is the scrape/emit interval for the data?
- What are the units associated with the y-axis?
- Are there seasonal trends to be aware of?
- How real time is this data? (aka “time to glass”) Does this chart automatically refresh or do I need to reload the page?
Check your observability knowledge
This guide is intended as a starting point to demystify observability for developers. It is up to you to take the next step and learn how observability is set up for your applications. This is a good time to make a friend on the SRE or central observability team who can help answer questions like:
- Where are all of the places I can send telemetry?
- What does our observability pipeline look like?
- What processing and transformation is done to metrics, logs and traces?
- How do we sample distributed traces?
- What is the retention period for each telemetry type?
- How do you define events?
Building out your observability skills
Because observability is such a broad topic – and often something SREs are learning on the job – it can feel like there’s almost too much to learn at once. But you don’t have to tackle everything and can start with the basics and build from there.
The observability concepts you should know are: What types of telemetry exist and how they relate to each other; the journey telemetry takes from instrumentation library to storage and retention, especially any transformation that’s done along the way; and finally how to tie it all together and understand time series charts.