The Problem
Chronosphere customers query their metric data using dashboards, automated alerts, and ad hoc exploration queries. Query results can vary from a few data points to billions.
A query resulting in billions consumes far more compute resources. This can lead to large queries starving small queries of database resources since customers purchase a finite amount. A typical example we see is a customer’s critical alert queries starved by a user running a large ad hoc exploration query. Our customers wanted a way to share their purchased resources across all users fairly.
Background
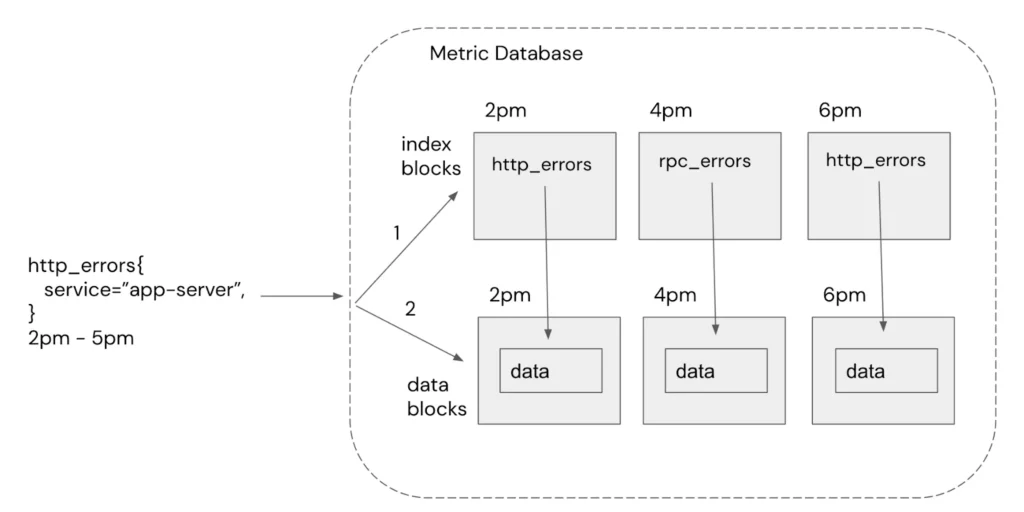
Before detailing the solution, it’s helpful to understand how Chronosphere processes queries at a high level. A query consists of a filter (e.g http_errors{service=”app-server”}) and a time range (e.g 2pm – 5pm). Chronosphere persists customer’s metric data in time window data blocks (e.g., every 2 hours) and indexes the data into separate time window index blocks. The index blocks map labels values to records in the data blocks to efficiently find the matching data records for a query.
The resource usage profile of a query is partitioned into two steps.
- Index Lookup – Traversing the index blocks looking for matches is CPU intensive since memory already holds most blocks.
- Data Retrieval – Retrieving data blocks is memory intensive since it may page new data blocks from disk into memory.
Historically nothing prevented a single user from consuming all the cores and memory, temporarily starving other users from running queries.
Goal
The goal was to fairly share compute resources when the system is under high concurrent load and allow a single user to consume all resources if the system is idle. In other words, we did not want to throttle users artificially.
Index scheduling
Large queries dominate
There are a fixed number of goroutine workers reserved for index processing. Typically there are more queries to process than workers available, resulting in queries blocked waiting for a worker. Once a query is scheduled on a worker, it runs until it’s done processing the index.

This can result in large queries delaying small queries from running.

We introduced an iterator pattern to allow a worker to process a chunk of the index at a time and then yield to another query waiting. When the query is scheduled again, it resumes scanning the next chunk of the index.
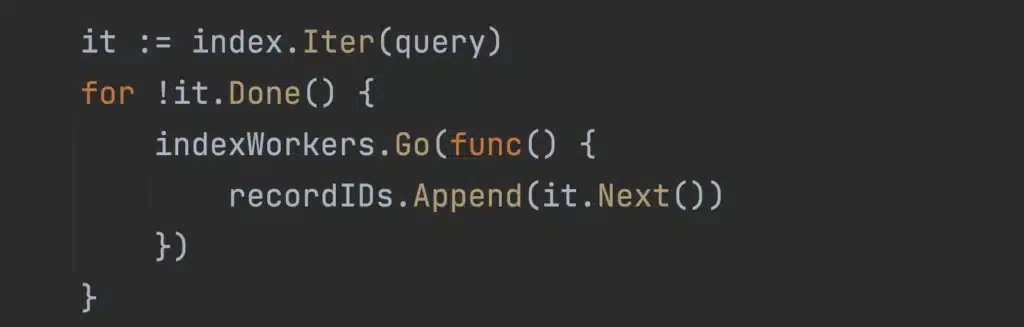
Large queries are chunked up into smaller units of work, allowing smaller queries to be scheduled sooner.

Many user queries
Large queries are not the only way to block other queries. A user can execute many queries in parallel from a dashboard and monopolize all cores at once, locking out all other users.

We needed to replace the first in, first out (FIFO) scheduler with a fair scheduler. The first attempt was to round-robin among all users waiting in the queue. In theory, user one would no longer block user two from running.

Surprisingly, round-robin did not solve the problem. Large queries could still delay small queries from running. The issue was that each query was allowed to run for an equal amount of time, whether it needed the full-time slice or not. The time slice chosen was milliseconds to avoid goroutine schedule thrashing and allow small frequent queries to only need one scheduling slice.

Rereading the Round Robin literature exposed this key insight:
It may not be desirable if the size of the data packets varies widely from one job to another. A user that produces large packets is favored over other users. In that case, fair queuing would be preferable.
The fair queuing implementation maintains a heap of waiting users sorted by least index time used. The user with the least index time used is scheduled next.

The main downside of fair queuing is the log(n) complexity to insert and remove waiting users from the priority queue. More efficient scheduling algorithms, like deficit round robin, sacrifice some fairness for efficiency. Ultimately, the number of waiting users is typically quite small, so efficiency gains would be negligible. Our actual implementation maintains a small sorted list for simplicity.
Data scheduling
A similar problem happened when retrieving data records from disk. Record retrieval was also first come, first serve, allowing a single user to consume all the available memory allocated for paging in data records from disk. Again the solution looked similar. We added an iterator to request records from disk and the same scheduling implementation, tracking bytes read from disk instead.
Memory issues
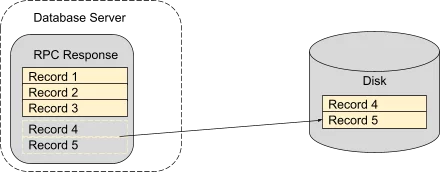
Unfortunately, pausing large queries resulted in higher memory usage overall. A query requires holding the entire RPC response in memory until it completes. Pausing queries resulted in more, typically larger, responses in memory waiting for disk access to complete.
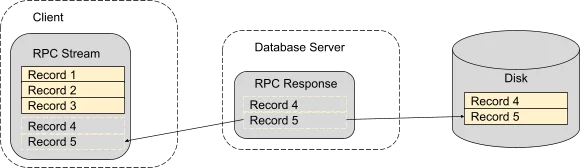
Introducing an RPC stream allowed the server to flush data records to the client after reading from disk, removing the need to buffer the records on the server.
Results
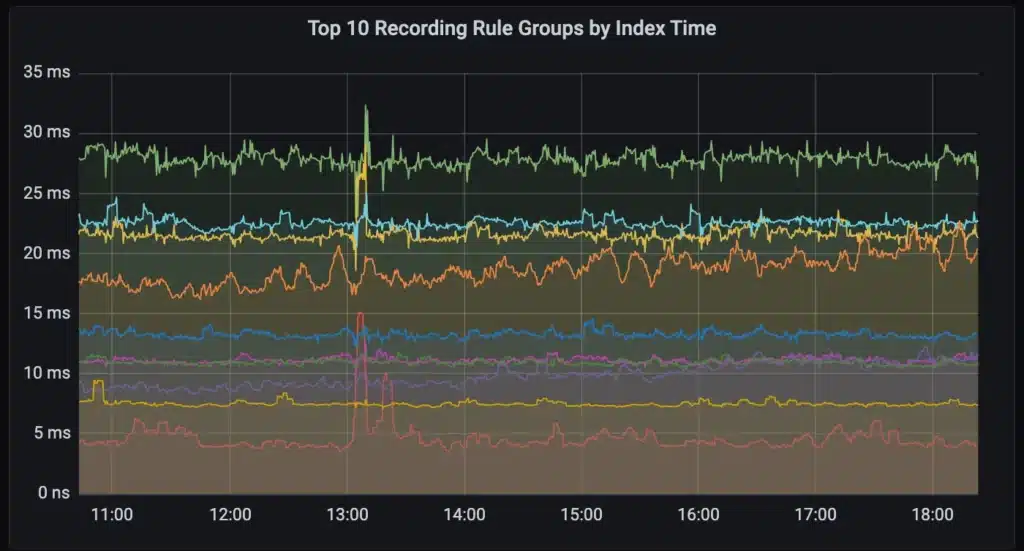
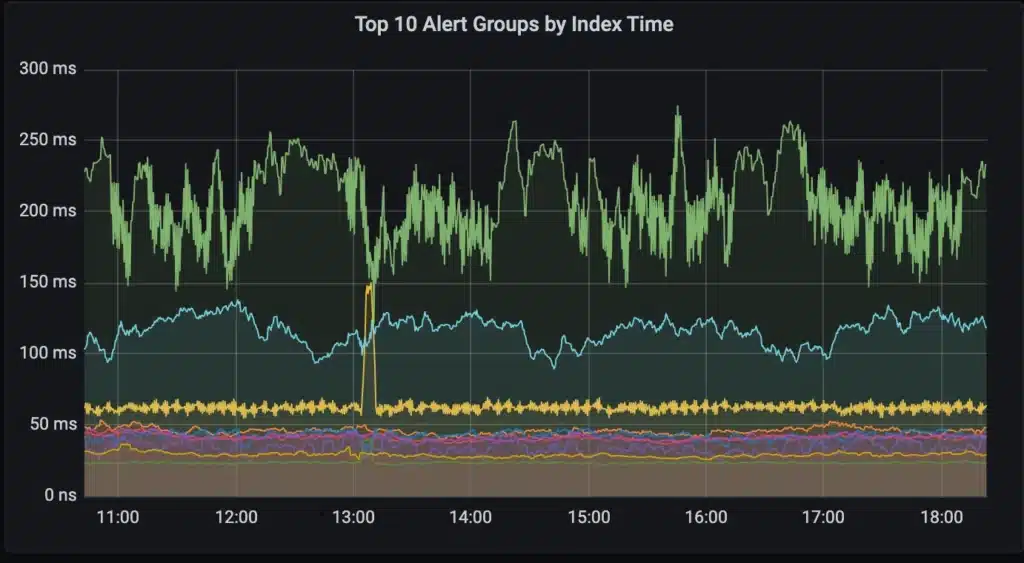
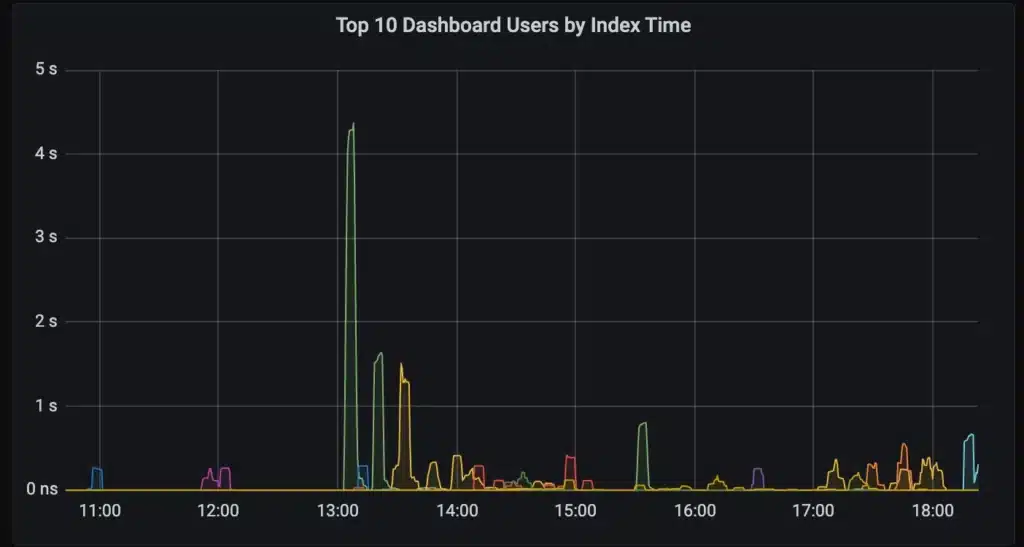
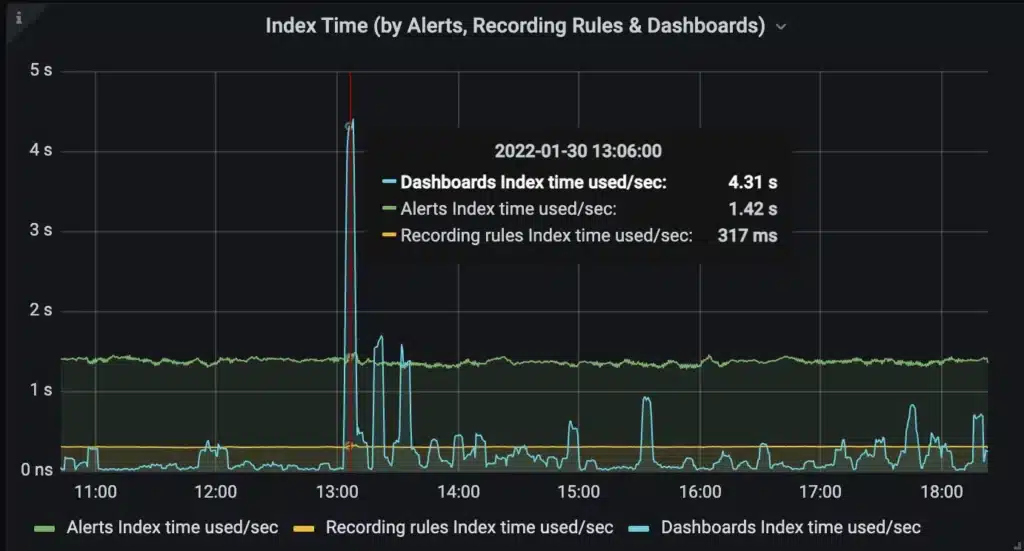
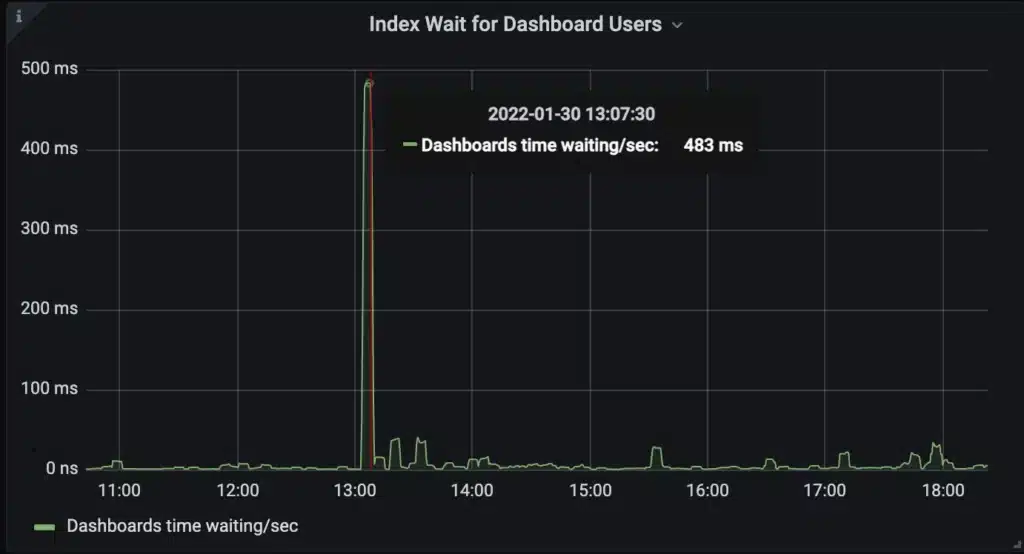
The new scheduler prevents heavy ad hoc users of the system from disrupting the critical automated queries. The graph below is how we monitor the index usage of our customers to ensure alert and recording rules are not disrupted by dashboards. A spike in dashboard traffic results in a temporary delay for some dashboard users while alert and recording rules are unaffected.
This project also enabled us to launch key insights for our customers. Chronosphere customers can now monitor which users are consuming system resources. This makes it easier to find problematic dashboards and rules impacting other system users.