")

If it’s not in the logs, did it really happen?
Logs are the foundational data of any observability effort. They provide information about every event and error in your applications, making them essential for troubleshooting. Elasticsearch allows us to store, search, and analyze huge volumes of data quickly, making it ideal for the massive volumes of log and other telemetry data generated by modern applications. It is also one of the components of the ELK Stack (Elasticsearch, Logstash, and Kibana), a widely-used log management solution.
Fluent Bit is the leading open source solution for collecting, processing, and routing large volumes of telemetry data, including logs, traces, and metrics. When used as the agent for sending logs to Elasticsearch, you have a highly performative telemetry pipeline.
In this post, we will show you how to send logs to Elasticsearch using Fluent Bit.
Before we get started
This tutorial assumes that you already have Fluent Bit installed and running on your source and that you have Elasticsearch.
For this tutorial, we will run Fluent Bit on an EC2 instance from AWS running Amazon Linux2 and send the logs to Elastic Cloud, Elastic’s hosted service. The configurations you use will vary slightly depending on your source and whether you are using Elastic Cloud or another version of Elasticsearch
Configure Fluent Bit
Input configuration
Fluent Bit accepts data from a variety of sources using input plugins. The Tail input plugin allows you to read from a text log file as though you were running the tail -f command
Add the following to your fluent-bit.conf file.
[INPUT]
    Name      tail
    Path      /var/log/*.log
    Tag       ec2_logs
Depending upon your source, you may need to adjust the Path parameter to point to your logs. Name identifies which plugin Fluent Bit should load, and is not customizable by the user. Tag is optional but can be used for routing and filtering your data (more on that below).
Output configuration
As with inputs, Fluent Bit uses output plugins to send the gathered data to their desired destinations.
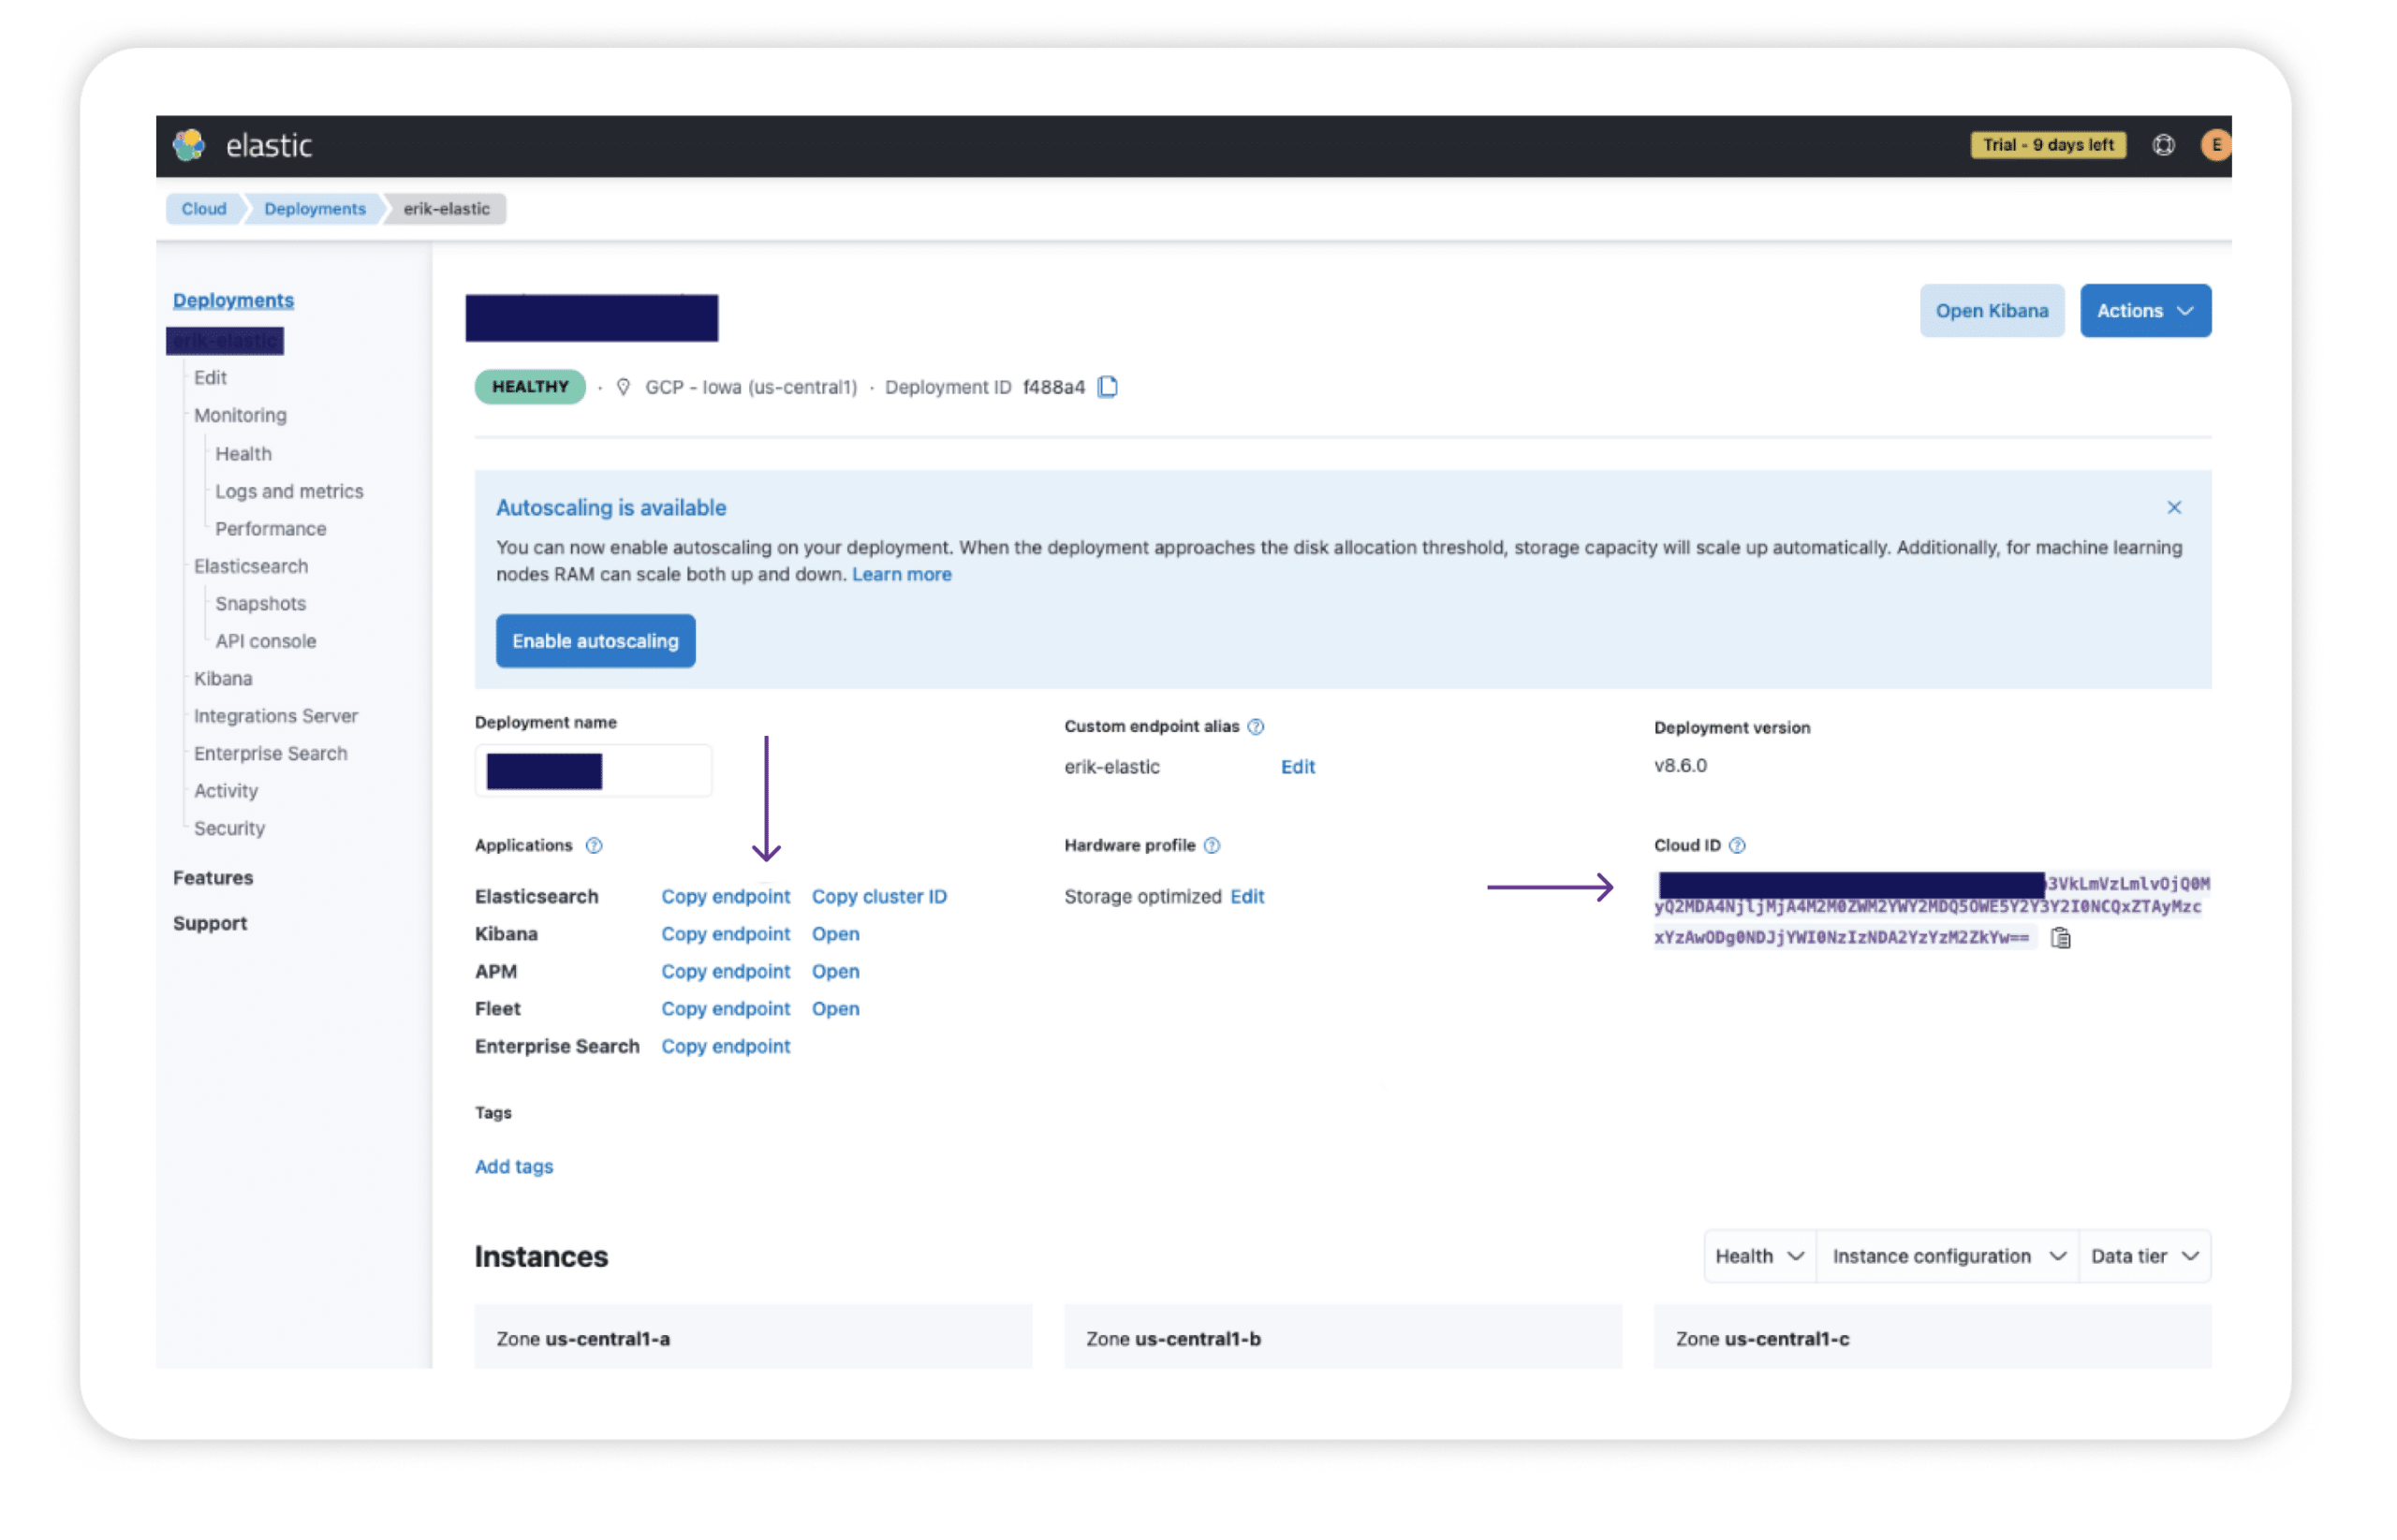
To set up your configuration, you will need to gather some information from your Elasticsearch deployment:
- The endpoint — see the image below for how to locate from the console
- The Cloud ID — see the image below for how to locate from the console
- The port number — if using Elastic Cloud, this will be 9243
- The authentication credentials — these will have been provided to you when you created your Elasticsearch cluster. If you failed to make a note of them, you can reset the password.
Once you have gathered the required information, add the following to your fluent-bit.conf file below the Input section.
[OUTPUT]
    Name  es
    Match *
    Host https://sample.es.us-central1.gcp.cloud.es.io
    Cloud_auth elastic:yRSUzmsEep2DoGIyNT7bFEr4
    Cloud_id sample:dXMtY2VudHJhbDEuZ2NwLmNsb3VkLmVzLmlvOjQ0MyQ2MDA4NjljMjA4M2M0ZWM2YWY2MDQ5OWE5Y2Y3Y2I0NCQxZTAyMzcxYzAwODg0NDJjYWI0NzIzNDA2YzYzM2ZkYw==
    Port 9243
    tls On
    tls.verify Off

[OUTPUT]
    # optional: send the data to standard output for debugging
    name  stdout
    match *
Be sure to update the values to match your own Elastic account details.
The host is your Elasticsearch endpoint. Cloud_Auth corresponds to your authentication credentials and must be presented as user:password.
The Match * parameter indicates that all of the data gathered by Fluent Bit will be forwarded to Elasticsearch. We could also match based on a tag defined in the input plugin. tls On ensures that the connection between Fluent Bit and the Elasticsearch cluster is secure. By default, the Port is configured to 9200, so we need to change that to 9243, which is the port used by Elastic Cloud
We have also defined a secondary output that sends all the data to stdout. This is not required for the Elasticsearch configuration but can be incredibly helpful if we need to debug our configuration.
Start sending your logs!
Once you have saved the changes to your fluent-bit.conf file, you’ll need to restart Fluent Bit to allow the new configuration to take effect:
sudo systemctl restart fluent-bitNote: If Fluent Bit is configured to utilize its optional Hot Reload feature, you do not have to restart the service.
Check to make sure Fluent Bit restarted correctly.
systemctl status fluent-bitAgain, these commands may differ depending on your system.
Your logs should now be flowing into Elasticsearch, and you should be able to search your data.
Manning Book: Fluent Bit with Kubernetes
Learn how to optimize observability systems for Kubernetes. Download Fluent Bit with Kubernetes now!
Learn what else Fluent Bit can do
We’ve just seen a basic configuration for getting log data from an AWS EC2 instance into Elasticsearch in Elastic Cloud. The Fluent Bit Elasticsearch output plugin supports many additional parameters that enable you to fine-tune your Fluent Bit to Elasticsearch pipeline, including options for using Amazon Open Search. Check out the Fluent Bit documentation for more.
Fluent Bit also allows you to process the data before routing it to its final destination. You can, for example:
- Convert unstructured data to structured data
- Add additional data that would generally be lost downstream
- Redact sensitive data
- Route data to different backends depending upon its content or tag
Routing is particularly powerful as it allows you to redirect non-essential data to cheaper storage (or even drop it entirely), potentially saving you thousands of dollars when using costly storage and analysis applications priced by consumption.
Why use Fluent Bit instead of Elastic Agent?
You may be asking yourself why you should use Fluent Bit rather than Elastic Agent. It’s a fair question.
Fluent Bit is vendor-neutral. Fluent Bit doesn’t care what backend you are using. It can send data to all of the major backends, including Elasticsearch, Chronosphere Observability Platform, Splunk, Datadog, and more. This helps you to avoid costly vendor lock-in. Transitioning to a new backend is a simple configuration change—no new vendor-specific agent to install across your entire infrastructure.
Fluent Bit is lightweight. It was created to be a lightweight, highly performant alternative to Fluentd designed for containerized and IOT deployments. Although its footprint is only ~ 450kb, it certainly punches above its weight class when it comes to processing millions of records daily.
Fluent Bit is open source. Fluent Bit is a graduated Cloud Native Computing Foundation project under the Fluentd umbrella.
Fluent Bit is trusted. Fluent Bit has been downloaded and deployed billions of times. In fact, it is included with major Kubernetes distributions, including Google Kubernetes Engine (GKE), AWS Elastic Kubernetes Service (EKS), and Azure Kubernetes Service (AKS).
Control the complexity of your Fluent Bit-based pipelines with Chronosphere
As we have seen, Fluent Bit is a powerful component of your telemetry pipeline and is relatively simple to configure manually. However, such manual configuration becomes untenable as your infrastructure scales to dozens, hundreds, or even thousands of sources.
Chronosphere Telemetry Pipeline, from the creators of Fluent Bit and Calyptia, streamlines log collection, aggregation, transformation, and routing from any source to any destination. Telemetry Pipeline also simplifies fleet operations by automating and centralizing the installation, configuration, and maintenance of Fluent Bit agents across thousands of machines.
This allows companies who are dealing with high costs and complexity the ability to control their data and scale their growing business needs.
About Fluent Bit and Chronosphere
With Chronosphere’s acquisition of Calyptia in 2024, Chronosphere became the primary corporate sponsor of Fluent Bit. Eduardo Silva — the original creator of Fluent Bit and co-founder of Calyptia — leads a team of Chronosphere engineers dedicated full-time to the project, ensuring its continuous development and improvement.
Fluent Bit is a graduated project of the Cloud Native Computing Foundation (CNCF) under the umbrella of Fluentd, alongside other foundational technologies such as Kubernetes and Prometheus. Chronosphere is also a silver-level sponsor of the CNCF.
Buyer’s Guide: Telemetry Pipelines
Build a smarter telemetry pipeline. Download The Buyer’s Guide to Telemetry Pipelines


