

Introduction
Fluent Bit is a fast, lightweight, and highly scalable logging, metrics, and traces processor. Its performance and efficiency make it especially suited to handle the massive streams of telemetry generated by cloud native environments and especially Kubernetes.
But how can you be sure your Fluent Bit deployment is operating efficiently — handling monitoring data at scale without bottlenecks, data loss, or silent failures?
In this post, we’ll walk through setting up a local monitoring stack for Fluent Bit using Prometheus and Grafana—lightweight enough to run on your laptop. We’ll cover installing and configuring each component, then explore the community-provided Grafana dashboard to understand the telemetry Fluent Bit exposes about its performance and how to interpret the visualizations.
Note: This setup uses default configurations and is not tuned for production workloads.
How Fluent Bit emits metrics

Fluent Bit exposes its metrics through a built-in endpoint at /api/v2/metrics/prometheus. This endpoint continuously emits metrics about Fluent Bit’s performance and internal state providing visibility into the health of plugins, rate of events, memory usage, retry counts and more. Aside from Fluent Bit itself, we’ll deploy Prometheus which is responsible for scraping and storing metrics.
To complement the internal metrics Fluent Bit emits, and to provide helpful context about the infrastructure Fluent Bit is running on we’ll deploy two additional components:
- Kube State Metrics — an add-on agent to generate and expose cluster-level metrics about Kubernetes resources. For our purposes we’ll look at the status and resource usage of Fluent Bit Pods and the Nodes they run on.
- Node Exporter — a Prometheus exporter for infrastructure metrics, which provides data about available CPU and Memory.
Finally we’ll deploy Grafana, our frontend for querying and visualizing these metrics via the community dashboard.
All together our local monitoring stack consists of: Fluent Bit, Kube State Metrics, Node Exporter which create metrics, Prometheus which will scrape and store those metrics and Grafana which will visualize these metrics.
This stack lets you observe Fluent Bit from multiple angles — from its own internals, the host it’s running on, and the Kubernetes cluster itself. Understanding this flow helps you not just visualize but interpret and troubleshoot based on real, meaningful telemetry.
Now that we know what we’re deploying and why, let’s get started!
Prerequisites
- Kubernetes Cluster: An existing Kubernetes cluster where Fluent Bit and monitoring components are deployed. This guide was tested with a single-node K3s cluster and KinD, but the instructions should apply to other Kubernetes distributions.
- Kubectl and Helm installed: This guide assumes you have both CLIs set up to interact with your Kubernetes cluster.
- Familiarity with Fluent Bit: concepts like inputs, outputs, parsers, and filters. If you’re new to Fluent Bit or need a refresher, check out the official documentation or the free self-paced Getting Started with Fluent Bit workshop.
Set up Fluent Bit monitoring
Follow the instructions below to set up monitoring for Fluent Bit:
Install Fluent Bit
We will install Fluent Bit using the Helm chart provided by the project.
1. Create a fluent-bit-values.yaml file with the content below. This allows us to override the chart’s default values and specify that we’re interested in having Prometheus scrape the v2 metrics endpoint.
service:
  annotations:
    prometheus.io/path: "/api/v2/metrics/prometheus"
    prometheus.io/port: "2020"
    prometheus.io/scrape: "true"

config:
  outputs: |
    [OUTPUT]
        Name stdout
        Match kube.*
2. Run the following command to install Fluent Bit.
helm repo add fluent https://fluent.github.io/helm-charts
helm upgrade -i fluent-bit fluent/fluent-bit --values fluent-bit-values.yaml
Install Prometheus
We will install Prometheus using the Helm chart provided by the project.
1. Create a prometheus-values.yaml file with the content below. This allows us to override the chart’s default values and configure a job to scrape metrics from Fluent Bit, enable Kube State Metrics and Node Exporter, and disable unnecessary components.
extraScrapeConfigs: |
  - job_name: fluent-bit
    kubernetes_sd_configs:
      - role: service
        namespaces:
          names:
            - default
    relabel_configs:
      - source_labels: [__meta_kubernetes_service_name]
        action: keep
        regex: fluent-bit
      - source_labels: [__meta_kubernetes_service_annotation_prometheus_io_scrape]
        action: keep
        regex: "true"
      - source_labels: [__meta_kubernetes_service_annotation_prometheus_io_path]
        action: replace
        target_label: __metrics_path__
        regex: (.+)
      - source_labels: [__address__, __meta_kubernetes_service_annotation_prometheus_io_port]
        action: replace
        regex: ([^:]+)(?::\d+)?;(\d+)
        replacement: $1:$2
        target_label: __address__

alertmanager:
  enabled: false

prometheus-pushgateway:
  enabled: false

nodeExporter:
  enabled: true

kubeStateMetrics:
  enabled: true
2. Run the following command to install Prometheus, Kube State Metrics, and Node Exporter.
helm repo add prometheus-community https://prometheus-community.github.io/helm-charts

helm upgrade -i prometheus prometheus-community/prometheus --values prometheus-values.yaml
Install Grafana
We will install Grafana using the Helm chart provided by the project.
Create a grafana-values.yaml file with the content below. This allows us to override the chart’s default values to configure our deployed Prometheus as a data source.
adminUser: admin
adminPassword: admin
datasources:
  datasources.yaml:
    apiVersion: 1
    datasources:
      - name: Prometheus
        type: prometheus
        url: https://prometheus-server:80
        access: proxy
        isDefault: true
2. Run the following command to install Grafana.
helm repo add grafana https://grafana.github.io/helm-charts

helm upgrade -i grafana grafana/grafana --values grafana-values.yaml
Verify Applications Are Running
Run the following command and verify that the status for all our pods is Running.
kubectl get pods

# Sample Output
NAME                                                 READY   STATUS    RESTARTS     AGE
fluent-bit-ggntx                                     1/1     Running   0            5m
grafana-65bf4d754-mp4hr                              1/1     Running   0            5m
prometheus-kube-state-metrics-54b9d6b598-n24pb       1/1     Running   0            5m
prometheus-prometheus-node-exporter-8j984            1/1     Running   0            5m
prometheus-server-65865bf69d-tp68k                   1/2     Running   0            5m
Import Fluent Bit Dashboard in Grafana
Follow these steps to import the dashboard
- Download this pre-built Grafana Dashboard from GitHub
- To access Grafana in your browser forward a local port to the Grafana Service by running the following command:
kubectl port-forward svc/grafana 3000:80 - Open https://localhost:3000 in your browser
- Log in using these credentials specified in the grafana-values.yaml
- • Username: admin
- • Password: admin
- In the primary menu find and select “Dashboards”
- • Click “New”
- • Find and select “Import” from the dropdown menu
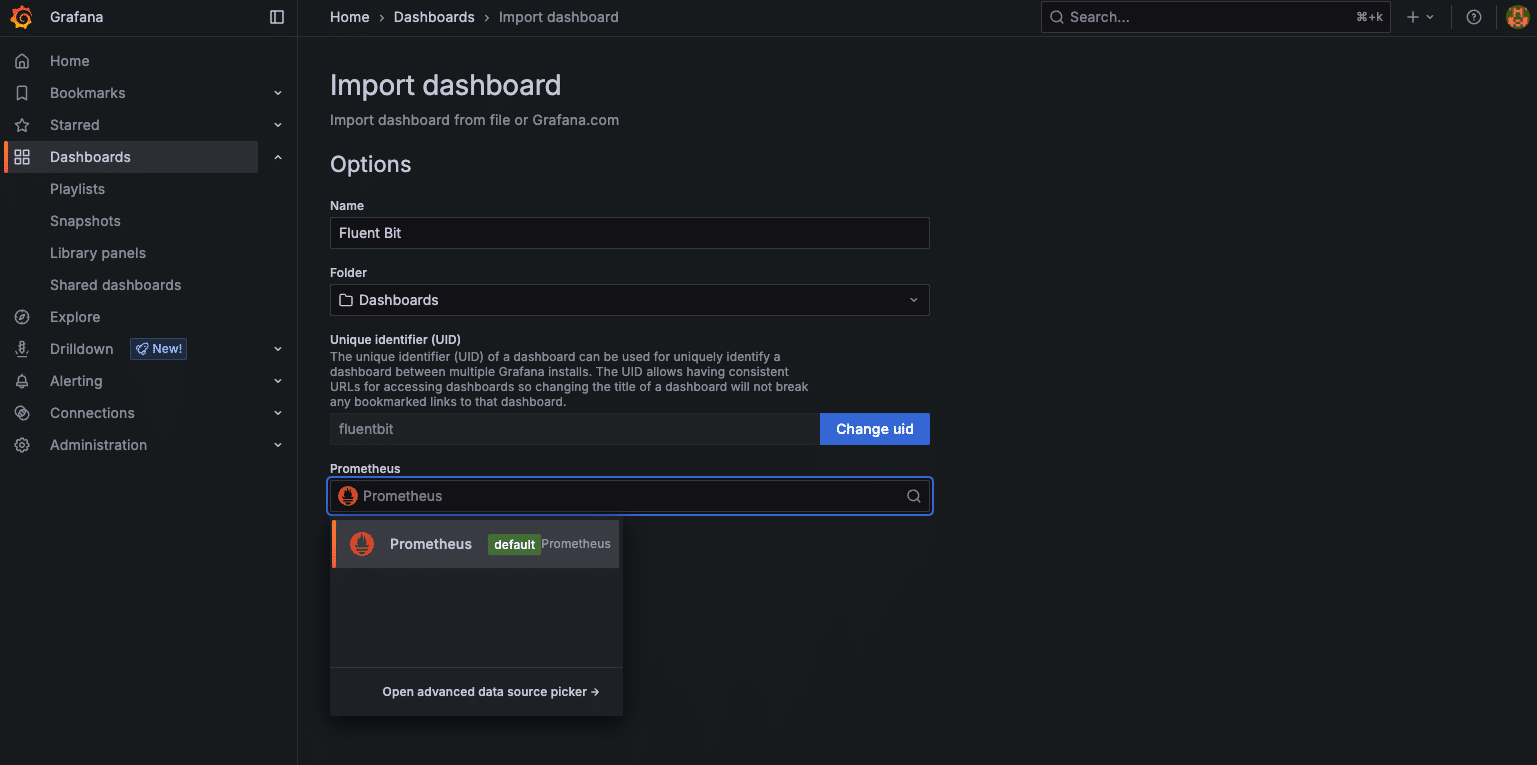
- Choose your import method either:
- • Upload a JSON file: Upload the dashboard file you downloaded directly
- • Paste JSON text: If you have the JSON content as text, paste it into the provided text area.
- Select Data Source: choose Prometheus from the dropdown menu

- Click “Import”
- Save: Save the imported dashboard
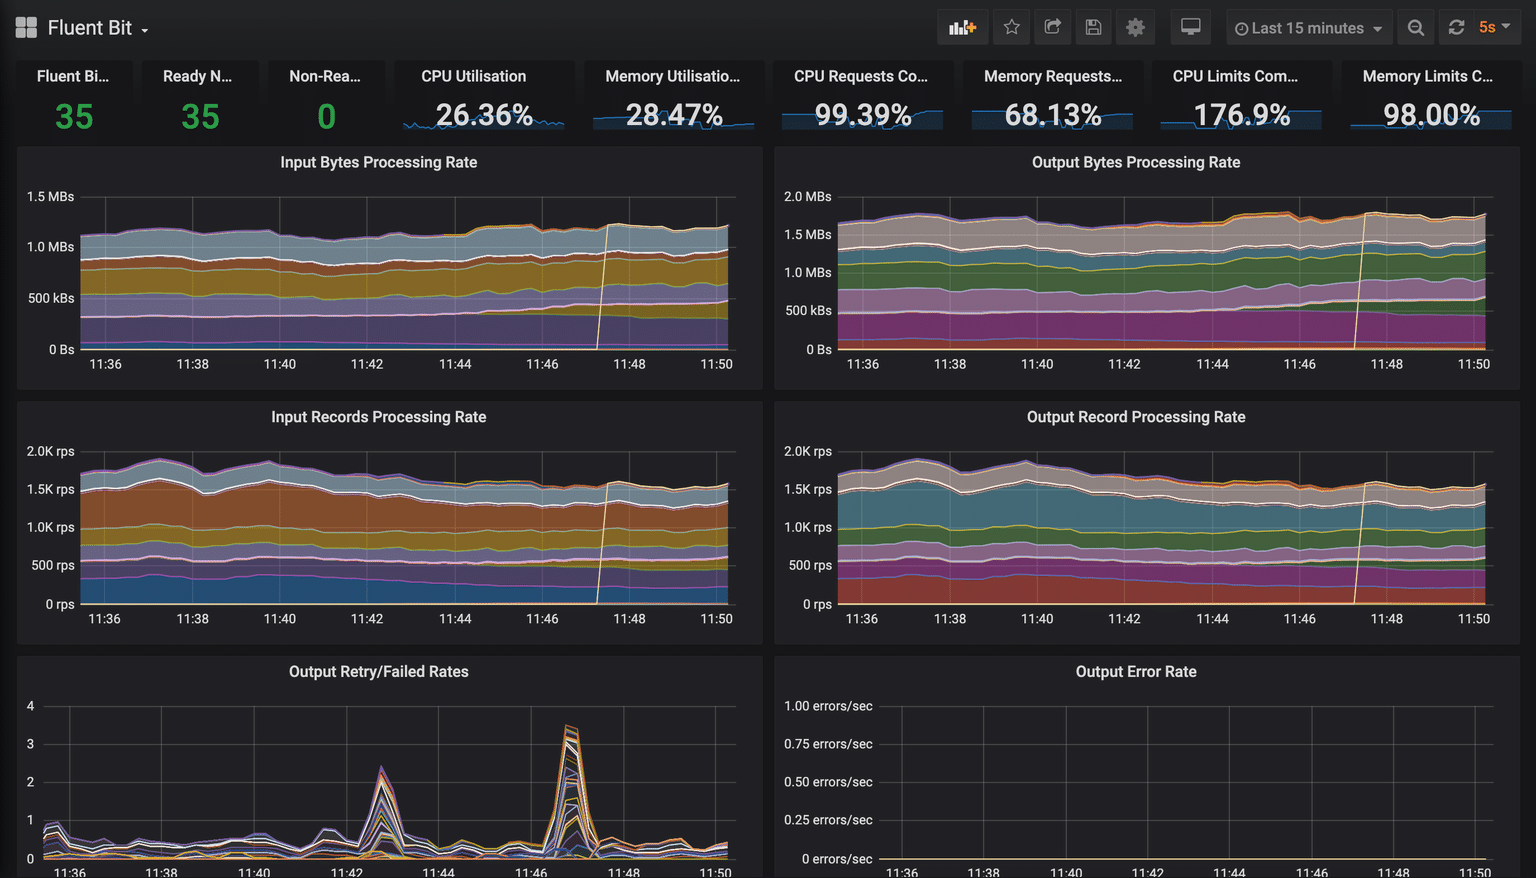
Ta da! Here is a sample image of the Fluent Bit Dashboard in Grafana.
Exploring the Fluent Bit Grafana dashboard
The Fluent Bit Grafana dashboard provides a lot of information at a glance and is broken down into logical panels. Let’s explore what each section tells us and how to interpret the data.
Resource limits and commitments

This panel provides an overview of resource consumption and allocation across your Kubernetes cluster – this helps you understand Fluent Bit’s operational environment.
What it shows:
- CPU/Memory Utilization: The actual percentage of CPU and memory being used across all nodes in the cluster.
- CPU/Memory Requests Commitment: The percentage of allocatable CPU and memory requested by all pods in the cluster.
- CPU/Memory Limits Commitment: The percentage of allocatable CPU and memory set as limits for all pods. This is the maximum a pod can consume before being throttled (CPU) or OOM-kill (memory).
Why it’s important:
- Overall Cluster Health: High utilization indicates the cluster is nearing capacity and could impact Fluent Bit’s performance if it can’t get the necessary resources.
- Resource Planning: Helps in understanding if your cluster is over-provisioned (low utilisation/commitment) or under-provisioned (high-utilization/commitment).
- Impact on Fluent Bit: While not directly related to Fluent Bit metrics, if the cluster is starved for resources, Fluent Bit pods might be throttled, evicted, or struggle to perform. This leads to log delays or data loss.
Interpreting the data and making decisions:
- High utilization (e.g., >80-90%): Your cluster is working hard.
Decision: Consider scaling up your cluster or optimising workloads. - High requests commitment (e.g., >80%): Most of the node’s guaranteed resources are already allocated.
Decision: Be cautious when deploying new workloads. Ensure Fluent Bit has adequate requests set to guarantee its operation. - High limits commitment: Pods are allowed to use resources up to their defined limits.
Decision: This is fine as long as actual utilization is lower. However, if limits are significantly higher than requests and utilization is also high, it can lead to “noisy neighbor” problems or CPU throttling.
- Requests vs. utilization: If utilization exceeds requests, your pod is bursting— this is fine when spare resources are available, but risky under load and could result in your Fluent Bit pods getting throttled or evicted. If it’s much lower, you’re over-requesting and wasting resources.
Fluent Bit cluster details

This section includes “Fluent Bits,” “Ready Nodes,” and “Non-Ready Nodes” panels. It gives a quick snapshot of your Fluent Bit deployment and the health of the underlying Kubernetes nodes.
What it shows:
- Fluent Bits: The total number of active Fluent Bit pods running in your cluster.
- Ready Nodes: The number of Kubernetes nodes currently in a “Ready” state.
- Non-Ready Nodes: The number of Kubernetes nodes in a state other than “Ready” (e.g., “NotReady”, “Unknown”).
Why it’s important:
- Deployment Verification: Ensures the expected number of Fluent Bit instances are running (e.g., one per node if using a DaemonSet).
- Telemetry Collection Coverage: Non-Ready nodes typically mean Fluent Bit (if run as a DaemonSet) isn’t collecting telemetry from those nodes.
Interpreting the data and making decisions:
- Fluent Bits count lower than expected:
Decision: Investigate why pods are not running. Check kubectl get pods -n <namespace> -l <fluent-bit-label> and kubectl describe pod <pod-name for errors.>
- Any non-ready nodes:
Decision: Investigate the cause (e.g., kubectl describe node <node-name>). This impacts log collection from affected nodes.
Input and output records processing rate
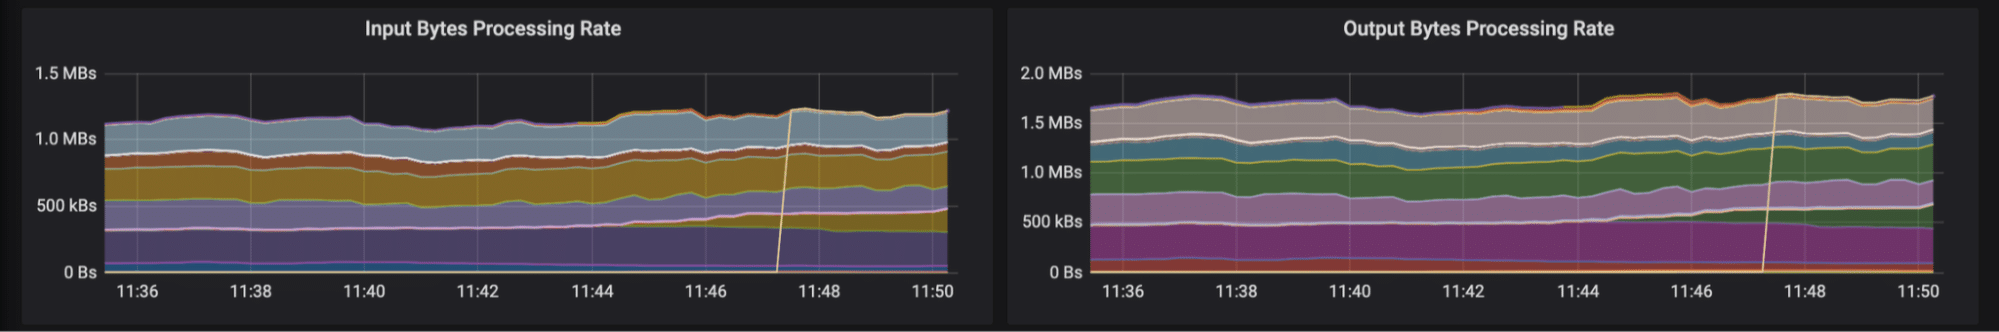
This section includes “Input Bytes Processing Rate” and “Output Bytes Processing Rate” panels. It shows the volume of data Fluent Bit is handling.
This section includes “Input Bytes Processing Rate” and “Output Bytes Processing Rate” panels. It shows the volume of data Fluent Bit is handling.
What it shows: The rate at which data (measured in bytes per second, Bps) is being ingested by Fluent Bit’s input plugins and the rate at which its output plugins are sending it out.
Why it’s important:
- Throughput monitoring: This is a key indicator of how much log traffic your system generates and how well Fluent Bit keeps up.
- Bottleneck identification: A large discrepancy where input rate is consistently higher than output rate can indicate backpressure from output destinations, network latency, or that Fluent Bit is a bottleneck (e.g., CPU-intensive filters, insufficient resources).
- Capacity Planning: Helps understand current load and predict future needs.
Interpreting the data and making decisions:
- Input Rate > Output Rate (sustained):
Decision: Fluent Bit’s internal buffers might be filling up. Check “Output Retry/Failed Rates” and “Output Error Rates”. Investigate the health and capacity of your output destinations (e.g., Elasticsearch, Kafka). Consider if Fluent Bit needs more resources or if filters are too complex.
- Sudden spikes or drops:
Decision: Correlate with application deployments, traffic surges, or known incidents. A sudden drop in output while input remains high is a red flag.
- Matching rates: Ideally, over time, the output rate should roughly match the input rate (minus any data dropped by filters).
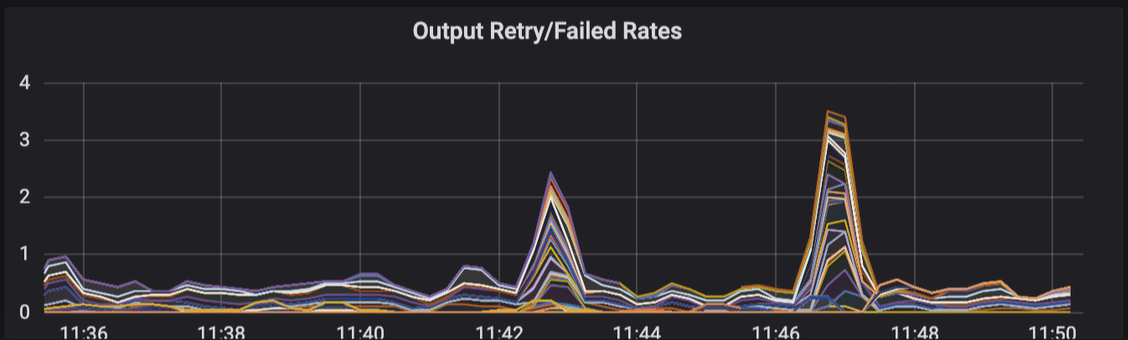
Output retry/failed rates
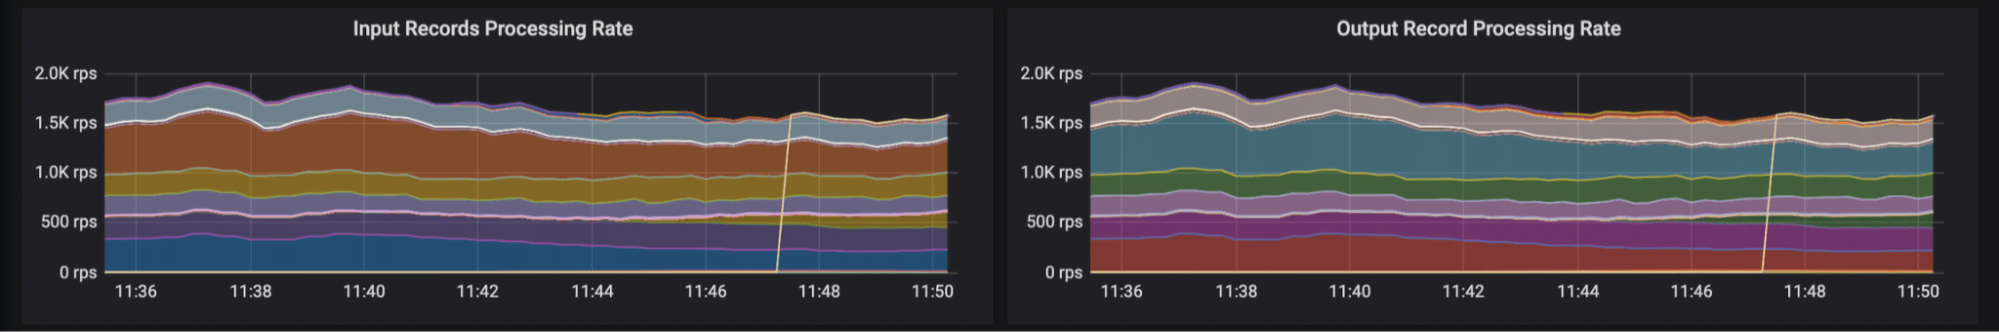
Similar to byte rates, these panels focus on the number of individual log entries.
What it shows: The rate at which individual log records (events/lines) are ingested and sent out by Fluent Bit (measured in records per second, rps).
Why it’s important:
- Event-level throughput: Complements byte rate. A high record rate with a low byte rate means many small log entries. A low record rate with a high byte rate means fewer, but larger, log entries.
- Performance tuning: Some operations in Fluent Bit (like parsing or filtering) might be more sensitive to the number of records than the raw byte size.
Interpreting the data and making decisions:
- Interpretation is similar to byte rates: Look for discrepancies between input and output, sudden changes, and overall load.
- Comparing byte vs. record rates: If the byte rate is high but the record rate is low, investigate large log messages. If the record rate is very high, even if the byte rate is manageable, Fluent Bit might be spending significant CPU on per-record processing.
Decision: Optimize log generation if messages are excessively large or numerous. Adjust Fluent Bit’s Buffer_Chunk_Size and Buffer_Max_Size considering average record size and volume.
Output Error Rates
This panel is critical for understanding the reliability of log delivery to your downstream systems.
What it shows:
- Retry rate: The rate at which Fluent Bit is attempting to resend data to an output destination after an initial failure.
- Failed retry rate (or dropped rate): The rate at which retries also fail, potentially leading to data being dropped if buffers are full and retries are exhausted.
Why it’s important:
- Delivery issues: Directly indicates problems with your output plugins or the configured destinations (e.g., Elasticsearch, Splunk, Kafka).
- Potential data loss: A high “Failed Retry Rate” indicates ongoing or imminent data loss. Fluent Bit has internal buffering but may eventually drop data if it can’t send data after the configured retries.
Interpreting the data and making decisions:
- Occasional/low retry rate: This can be normal due to transient network issues or the brief unavailability of the output destination.
Decision: Monitor, but usually no immediate action unless it becomes persistent.
High/sustained retry rate:
Decision: Investigate the health and capacity of the output destination. Check network connectivity between Fluent Bit and the destination. Review Fluent Bit logs for specific error messages related to the output plugin.
Any failed retry rate:
Decision: This is a high-priority alert. Data is likely being lost or is at high risk of being lost. Investigate the output destination, Fluent Bit configuration, and network paths. Check Fluent Bit’s buffer limits (Mem_Buf_Limit or storage.max_chunks_up).
Conclusion
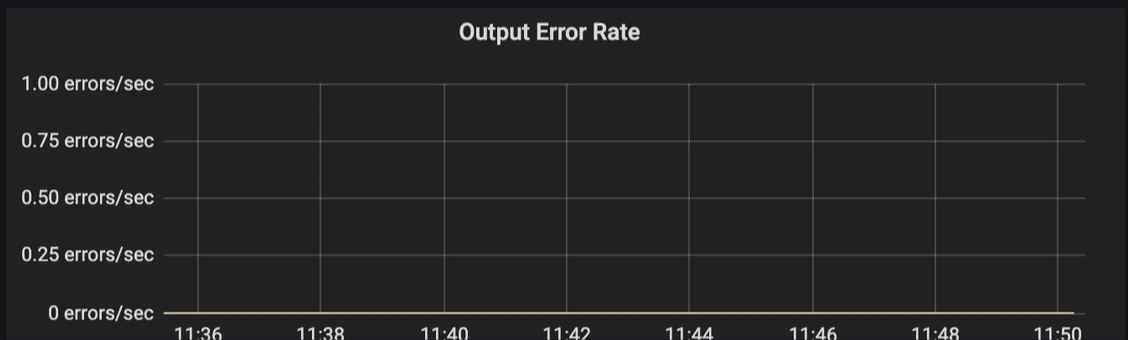
This panel displays the rate of terminal errors generated by Fluent Bit’s output plugins. These errors represent non-recoverable failures where records are immediately dropped without retry attempts.
What it shows: The rate of terminal errors encountered by output plugins during their operation. These errors occur when an output plugin returns FLB_ERROR status, indicating a failure that Fluent Bit won’t attempt to recover from.
Why it’s important:
- Problem identification: Helps pinpoint immediate, non-recoverable issues with specific output configurations or incompatibilities with the destination.
- Data loss detection: These errors indicate data that is being dropped without retry attempts, representing permanent data loss.
- Distinct from retries: Unlike retries, which represent temporary failures that will be attempted again, these errors represent terminal failures.
Interpreting the data and making decisions:
- Any sustained error rate:
Decision: This warrants immediate investigation as it indicates data loss. Check the Fluent Bit logs on the instances reporting errors for detailed error messages. These messages will typically point to the specific output plugin and the nature of the error (e.g., “connection refused,” “authentication failed,” “invalid payload”).
- Correlate with changes: Review those changes if error rates spike after a configuration change or an upgrade to Fluent Bit or the output destination.
- Correlate with retry metrics: Compare with fluentbit_output_retries_total and fluentbit_output_retries_failed_total to understand the full error picture. If you see high error rates but low retry rates, it suggests immediate terminal failures rather than temporary issues.
- Common causes: Incorrect endpoint, port, or credentials for the output
-
- TLS/SSL handshake issues
- Data schema mismatches (e.g., sending JSON that the destination can’t parse)
- Rate limiting by the output destination
- Misconfigured output plugin parameters
Whitepaper: Getting Started with Fluent Bit and OSS Telemetry Pipelines
Getting Started with Fluent Bit and OSS Telemetry Pipelines: Learn how to navigate the complexities of telemetry pipelines with Fluent Bit.


