Introducing Chronosphere Histograms
Today, we are excited to announce Chronosphere Histograms – an innovative histogram type designed to simplify implementation, improve query efficiency, and deliver more accurate results. Chronosphere Histograms provide an implementation of multiple histogram types, including OpenTelemetry exponential histograms and Prometheus native histograms. Plus, Chronosphere Histograms work with our Control Plane – enabling customers to manage, transform, aggregate and reduce the costs of histogram metrics at scale as efficiently as any other metric.
Why do we need a new type of Histogram?
Histograms are an important tool for analyzing the performance of modern software systems. Ask developers, and they will tell you. Ask those same developers about the shortcomings of histograms, and you’ll get an earful. Explicit bucket configuration, high likelihood of high margin of error, the list of pitfalls goes on. And the more complex systems get, the more both their value and difficulty increase.
Histograms have been used in observability for a long time. Legacy histograms were added to Prometheus in 2015. However, their initial design presents problems when used in the scale or highly complex environments we see today.
The open-source community recognized the increasing challenges modern architectures create for histograms. Prometheus and OpenTelemetry agreed upon a new compatible histogram type that solves the problems inherent in the design of legacy Prometheus histograms.
We’ll delve into the specific challenges shortly. But first, let’s quickly review what a histogram is.
What is a histogram?
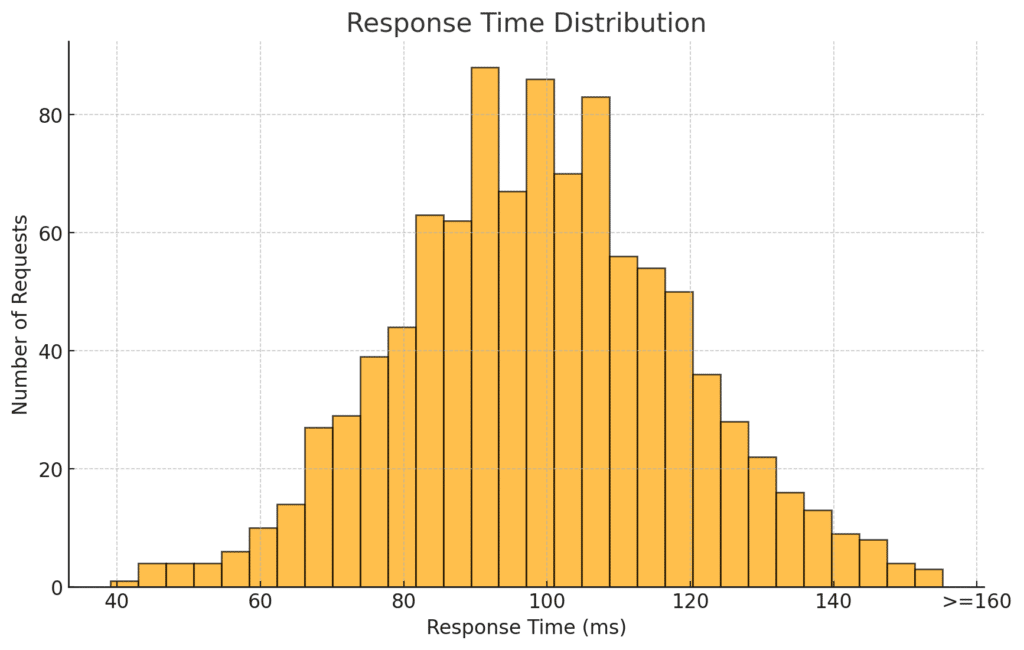
Histograms are a general mathematical tool for graphically showing the frequency of distributed data values. They are displayed like bar charts, each representing a range called a “bucket.” The bars count the measurements that fall into each bucket.
Check out the news on the MQ

An everyday use case for histograms in observability is measuring latency. Because latency can vary widely, using just an average or median (p50) often doesn’t accurately reflect what many users experience. To get a complete understanding, you need to examine the “long tails” of latency. Histograms allow you to do that and additionally compute different statistics across arbitrary dimensions and time windows, in a way that pre-computed percentiles do not.
Let’s look at a very simplified but clear example of how histograms are helpful:
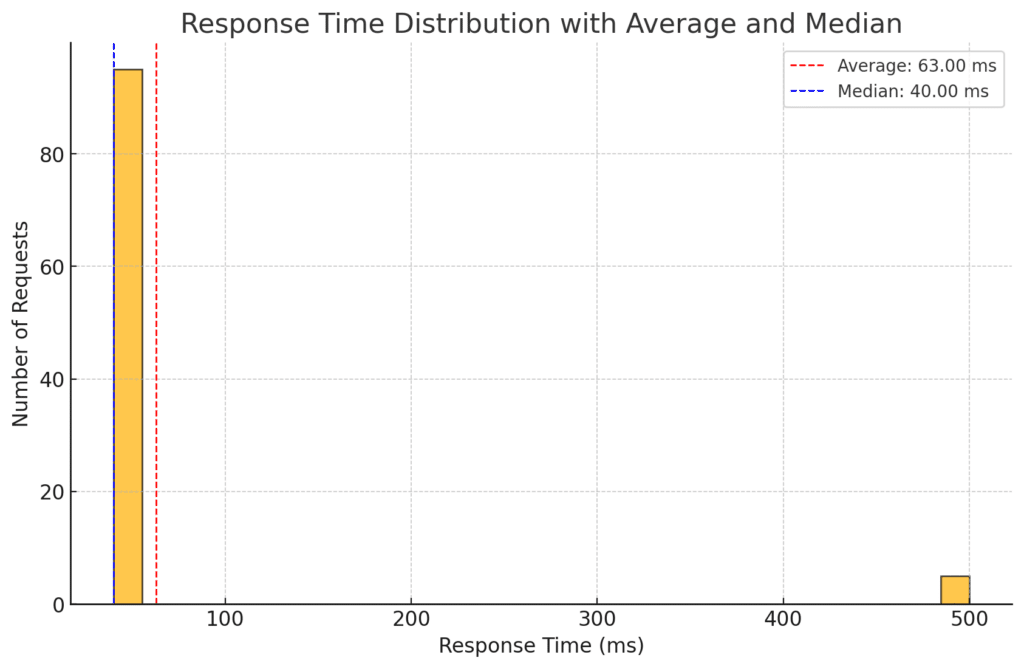
If a service handles 100 requests, with 95 completing in under 40 milliseconds (ms) and 5 taking 500 ms, the average response time is 63 ms, and the median (p50) is 40 ms. However, this misses the fact that 5% of users experience much slower response times. Using a histogram to summarize the latency of all 100 requests lets us easily visualize the 95th percentile (p95) and see that 5% of requests experience 500 ms response times.
If you are a large eCommerce company or financial institution, delays affecting 5% of customers can mean massive revenue losses and customer dissatisfaction.
Histograms help tackle these issues. They visually show how often data values occur within different ranges. This makes it easy to spot unusual patterns and outliers. As a result, developers can diagnose and resolve issues more quickly.
While precomputed percentiles historically have also tried to offer meaningful statistics like this, they are inflexible and unergonomic at query time allowing usually only per-host statistics which becomes increasingly inaccurate when calculating the long tail of a busy endpoint or operation across many instances.
Challenges with legacy Prometheus histograms
The challenges with legacy Prometheus histogram stem from two major design constraints. First, the legacy Prometheus histogram isn’t a first-class metric type and instead is a compound metric. It’s scraped and persisted as multiple counter time series, which is both inefficient and constraining.
Second, it only supports an explicit fixed bucket layout that each time needs to be specified before use. Once defined, the bucket layout doesn’t change, regardless of the values being recorded. This rigid structure isn’t practical in modern, complex environments where the distribution of data changes over time.
- Toilsome developer experience – Legacy Prometheus histograms can create a lot of busy work for developers and create a high barrier for first time users. The manual bucket layout is hard to define, especially if they don’t know what the data distribution looks like, so the developer has to guess. If they get it wrong, they have to iterate on the definition until they think they have it right. Even after getting it right, system improvements can change data distributions over time. This requires constant monitoring and manual updates to ensure accuracy over time.
- Difficult to query histograms as bucket layouts change over time – Aggregation requires a consistent bucket layout across time and labels. If histograms have different buckets layouts, they can’t be combined or queried together. This is especially problematic when iterating to improve the bucket layout. For example, SLO queries spanning a time window with different bucket layouts will return invalid results until there’s enough historical data with the new bucket layout.
- Trade accuracy for cost – The more buckets, the higher the accuracy, but accuracy comes at a high cost. This is because each bucket results in a unique time series, adding a multiplicative effect to histogram cardinality. To reduce cardinality, developers tend to create fewer, wider buckets. These wider buckets can lead to error rates in quantile calculations, sometimes as large as the difference between the consecutive bucket sizes.
- Limited use cases – In modern environments, fixed buckets limit the flexibility of what you can do with histograms. Use cases that require dynamic and precise representation of a distribution are problematic. For example, using a static bucket layout to summarize a stream of latency measurements with different latency distributions will lead to inaccurate or incorrect statistics. Imagine if your Envoy histograms automatically used the best histogram bucket layout based on the latency distribution they’re representing.
These two issue combine to cause the following major problems:
Enter Chronosphere Histograms! Better histograms with OSS compatibility and cost control
Here’s how the new single-value Chronosphere Histogram and new exponential growth bucket layout available in OpenTelemetry SDKs and Prometheus clients combine to solve the legacy Prometheus histogram problems:
- Frictionless developer experience – The Developer effort required to implement and maintain accurate histograms is significantly reduced. They no longer have to guess which bucket layout is best. They simply declare that they want a histogram and the OpenTelemetry SDK or Prometheus client automatically selects and scales a bucket layout using the exponential growth algorithm, even as the data distribution changes over time. No need to continuously monitor and update the bucket layouts.
- A more flexible and intuitive query experience – Because histograms use the mergeable exponential bucket layout, queries across different services work correctly. In addition, new histogram query functions provide a more intuitive query experience.
- Improved quantile accuracy – Chronosphere processes and persists the histogram as a single value and time series. With the more efficient storage, histograms with exponential bucket layouts by default can store up to 160 buckets in a single value. Most organizations limit legacy Prometheus histograms to 20 buckets or less to reduce the cost of high cardinality. This higher resolution histogram allows for more accurate quantiles, such as P99, P50, or P85.
- New use cases – Because histograms with exponential bucket layout define the bucket layout automatically, they open up new opportunities to use histograms. One of our customers uses them to aggregate a stream of timer metrics from browser instrumentation. Legacy Prometheus histograms struggle with varying latency profiles due to fixed buckets. Now, with exponential bucket layouts, the OpenTelemetry SDK and Prometheus client automatically use the best bucket layout for each unique time series, providing better data summarization.
Using Prometheus Native or Exponential Histograms with Chronosphere
Chronosphere customers can send OpenTelemetry exponential histograms (delta or cumulative) via the OpenTelemetry Collector to Chronosphere or they can use the Chronosphere Collector to scrape Prometheus native histograms. All Chronosphere Observability Platform features work with both histogram formats and the exponential growth bucket layout.
Chronosphere’s Control Plane helps customers reduce the costs of Histogram metrics, like it does for any other metric. Customers can define aggregation rules to reduce cardinality and drop rules to drop an entire histogram time series. A new HISTOGRAM aggregation function gives customers a way to aggregate measurements or gauges. For example, when aggregating away the instance label on a container metric like container_memory_usage_bytes, the HISTOGRAM aggregation function records the distribution of all gauge values in the time window.
We’re excited about the new problems customers will solve with the Chronosphere Histogram metric type and Control Plane features!


