


It’s no secret cloud native architecture and environments are complex. They’re composed of thousands of containers, microservices, applications, and infrastructure layers that all are simultaneously running and dependent on each other so systems (both internal and external) stay online. These components also produce high cardinality data – where there are multiple possible outputs for a single data point – which makes data management challenging.
Cloud native’s complicated nature means that monitoring and observability solutions are a requirement to help effectively collect data, set alerts for issues, and provide insights to developers about overall system health. Prometheus was created with these goals in mind.
Prometheus is a cloud native, open source monitoring and alerting system, created by Mike T. Proud and Julius Volz with support from SoundCloud. It is directly supported by Kubernetes and was the second project from the Cloud Native Computing Foundation (CNCF). It is primarily written in Go, but other versions use Java, Python, and Ruby and is released through the Apache 2.0 license.
Read further to learn about Prometheus’ main features, what it can do, its main use cases, and best practices.
Prometheus monitoring components
The primary Prometheus server is a standalone server that runs as a monolithic binary with no dependencies. Its main features include:
- A multi-dimensional data model that identifies time series data identified by metric name and key/value pairs
- Efficient time series
- Prometheus Query Language (PromQL) to effectively search through information
- Autonomous single server nodes that don’t rely on distributed storage
- A pull model over HTTP for time series collection
- Intermediary gateway to push time series from scraped jobs to server
- Service discovery and static configuration for target discovery
- Capabilities for dashboarding and graph generation
- Streamlined operation and installation process
All of these components come together to provide organizations an open source monitoring option that is reliable, has quick alerting, and is straightforward to set up and deploy.
What Prometheus can monitor and metrics types
Cloud native is more distributed and fragmented compared to monolithic environments; so developers need monitoring solutions that can reliably support high cardinality at scale.
As a CNCF project, Prometheus provides a unified solution for metrics collection and storage and alert generation, which makes it easier to monitor and understand complex systems. It is designed to monitor infrastructure, application, Kuberentes, and business metrics within a cloud native environment – in a way that is easy for developers to install and start using within a few hours.
It uses metrics (or numerical measurements) to help developers understand how well their application or service is working. There are four main metrics types that developers can collect: counter, gauge, summary, and histogram.
- Counters track how often an event occurs in an application or service.
- Gauges take periodic snapshots of a metric at a specific point in time.
- Histograms sample observations by history or count.
- Summaries also track distributions over time, but directly expose quantile values.
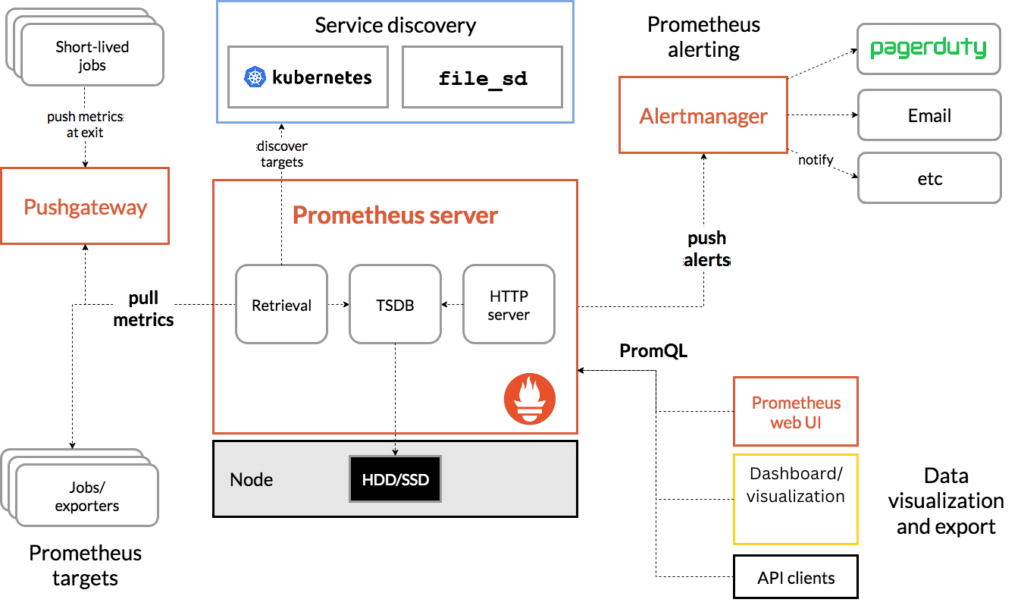
How Prometheus works and its architecture
The Prometheus architecture includes a main server to scrape and store time series data, client libraries for application code instrumentation, a push gateway for short-lived jobs, special purpose exporters, and an alertmanager.
Prometheus’ multiple exporters to collect data across different sources. Developers can use exporters to get system, application, service, or custom metrics within their cloud native environment. The server has exporters for databases, hardware, logging, issue tracking, messaging systems, storage, HTTP, FinOps, and APIs.
Once the exporters scrape metrics from instrumented jobs, the Prometheus server stores all collected data samples locally. It then applies rules to either aggregate data, record new time series, or generate alerts.
What is PromQL?
PromQL is how Prometheus users can query their collected infrastructure and deployment data. It is designed to work with time series databases and provides time-related queries.
Developers also use PromQL to manage Prometheus alerting. Developers can set rules in PromQL, which then communicates Alert Rules to the alertmanager to fire when necessary.
Three basic queries developers can use to get started with Prometheus are:
- Request rates: How many requests a service gets.
- Error rate percentages: Amount of errors a service encounters (relative to total number of requests).
- Service latency percentiles: How fast services respond to user requests.
With queries, users can display results either as a graph or tabular data to get a look at how specific services are performing and compare data against internal service-level objectives (SLOs).
When to use Prometheus
Designed for cloud native environments, which have dynamic service-oriented architectures, Prometheus works best for organizations that collect straight numeric time series data and supports multi-dimensional metrics data collection.
It’s also designed to be reliable. It’s set up without any network storage or remote device dependencies, so it runs even if other infrastructure is down. It also uses pull metrics collection by design, which means you don’t have to modify or redeploy existing code or applications. Furthermore, it also doesn’t require any extensive infrastructure to use for your cloud native environment.
This makes Prometheus ideal for when you need a metrics/time series based alerting and monitoring system for cloud native infrastructure that doesn’t require a lot of hardware investment. For one server, developers need (at minimum) 2 CPU cores, 4 GB of memory, and 20 GB of free disk space.
When not to use Prometheus
Prometheus is designed for reliability first and foremost. It allows users to gather statistics and time series about your systems, but may not be as granular as organizations might need depending on the metrics that you collect. For example, for a service like per-request billing, Prometheus data might not be specific enough.
Prometheus is also not designed to ingest logs or act as a primary dashboarding/visualization tool. For both of these use cases, developers will need different tools. Additionally, while it can run smoothly with up to 10 of million active time series, it is not designed to be a long-term data storage solution and does not automatically scale with environments.
What are some Prometheus best practices?
With any open source tool use, organizations should have best practices in place to ensure smooth operation. For Prometheus specifically, make sure to:
Select the best standard exporter
Because Prometheus uses exporters to scrape for default data, developer teams should research which exporter will work best for their foundational data collection and reporting needs – as it can play a large role in quality of data and overall monitoring strategy. Use feature overviews, recent updates, user reviews, and security alerts to figure out the most ideal exporter. For custom metrics, you’ll have to use manual code instrumentation to insert and generate the business metrics you want to collect.
Label carefully to avoid confusion and extra storage
Use the exporter documentation to ensure that any collected data has all the necessary context and strive to have consistent labeling across monitoring targets. Each label that developers use in Prometheus uses resources, so developers want to have labels that are needed and used to oversee their cloud native environment – not take up unnecessary storage.
Set actionable alerts to reduce troubleshooting time
Monitoring strategies require planning and documentation so that developers and engineers know what’s happening when they get an alert. Before implementing Prometheus, determine what events and services are critical to monitor and what their thresholds are for receiving an alert, as well as what relevant information should be included.
Know when you need to scale
Prometheus is a way to easily start open source monitoring for cloud native and Kubernetes instances, but it does require technical and developer resources to manage over time and has scalability limitations. Additionally, it can get complex for large scale enterprise environments that require data duplication or have spread-out infrastructure. Be sure to have indicators in place when it is time to either implement Prometheus’ Federation feature, use functional sharding, or work with a vendor.
Before Chronosphere, Abnormal Security had trouble with metrics availability and scalability; their 10-12 million active metrics were tracking to hit 50 million. Knowing about this rapid growth and needing a service that could handle so many metrics, they reached out to Chronosphere to help manage their Prometheus instances. In doing so they saw increased stability, reliability, and reduced costs.
Interested in more about the connection between Prometheus and cloud native? Learn five reasons why the two work best together.


