")
Taming data growth with Chronosphere
As big Kubernetes users ourselves, we know that one of the best ways to run Kubernetes is to use Google Kubernetes Engine (GKE). Earlier this year, Google Cloud announced a new mode for running GKE called Autopilot. Google Cloud designed Autopilot to reduce the operational cost of managing clusters, optimize clusters for production, and yield higher workload availability.
GKE Autopilot takes a lot of the legwork and complexity out of managing Kubernetes clusters, saving you time and money. But, like all critical infrastructure, you still need a plan for monitoring and observability for the cluster. That’s where Chronosphere comes in.
Chronosphere is the only observability platform that puts you back in control by taming rampant data growth and cloud-native complexity, delivering increased business confidence. Chronosphere was built from the ground up for the scale, complexity, and ephemerality of cloud-native environments and is open-source compliant, supporting Prometheus metrics ingest protocols, dashboards, and query languages.
Chronosphere + GKE Autopilot
By using Chronosphere and GKE Autopilot together, engineers are more productive by giving them faster and more actionable alerts that they can triage rapidly, and allows them to spend less time on monitoring instrumentation. All while knowing that their clusters are running in a secure, highly available, and optimized manner.
Ready to get started with Chronosphere and GKE Autopilot? This post takes you through the steps needed.
The Chronosphere collector
The Collector’s function is to ingest metrics and send them to the Chronosphere service through a connection secured by a revocable API token. It does this by discovering and scraping Prometheus-compatible endpoints. If the Collector can’t scrape certain endpoints or components, you can manually push metrics to it.
When running the Collector in Kubernetes, you run it as a Kubernetes DaemonSet on each node you want to scrape the endpoints of using annotations or a ServiceMonitor.
The Collector has a lot of configuration options, but you can use this sample manifest to create the Kubernetes resources needed, including a ConfigMap of recommended defaults, with some values populated with variables from the manifest.
There are a couple of changes to the manifest to optimize the Collector for running with Autopilot.
- Adds a PriorityClass to the DaemonSet to ensure that Kubernetes schedules the DaemonSet on a node with enough resources to run the Collector.
- Reduces the resources used by the DaemonSet to match Autopilot limitations
Authentication with the Chronosphere service
For the Collector to send metrics to your Chronosphere instance, you need an API token and the address of your instance, the domain name that ends in .chronosphere.io:443 .
Next, base64 encode the address and API token and add them into the Secret resource in the Collector manifest.
Connecting your GKE autopilot cluster to Chronosphere
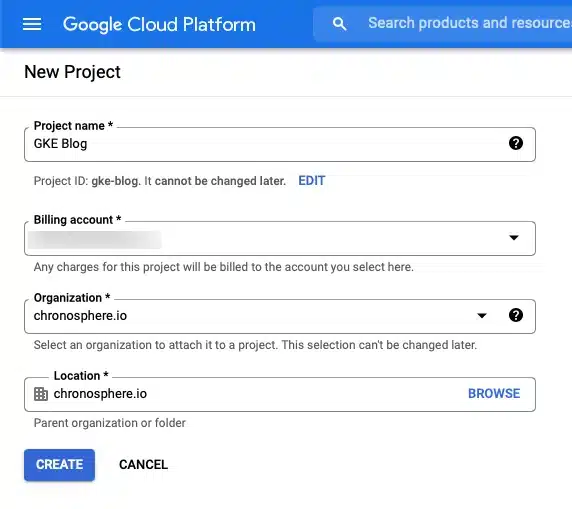
Create a new project in the Google Cloud console, and within the project, enable the Kubernetes Engine API.

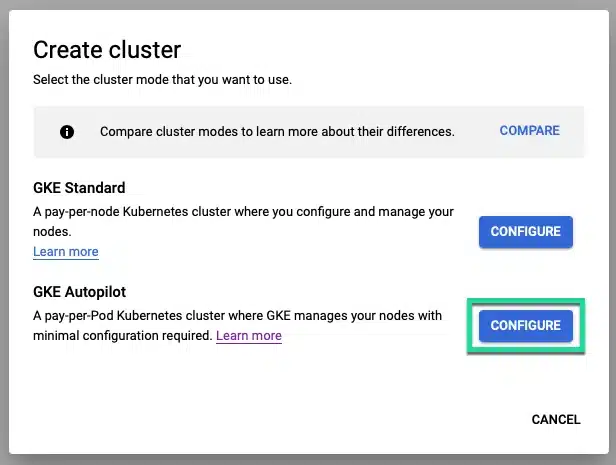
Create a cluster using the GKE Autopilot mode, and on the configure screen, adjust any settings you need.
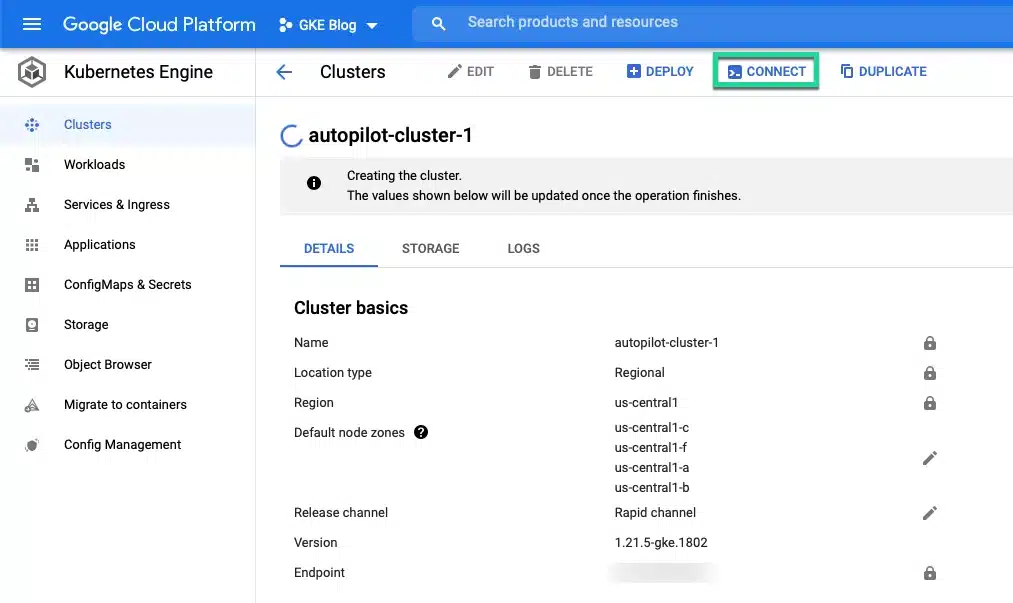
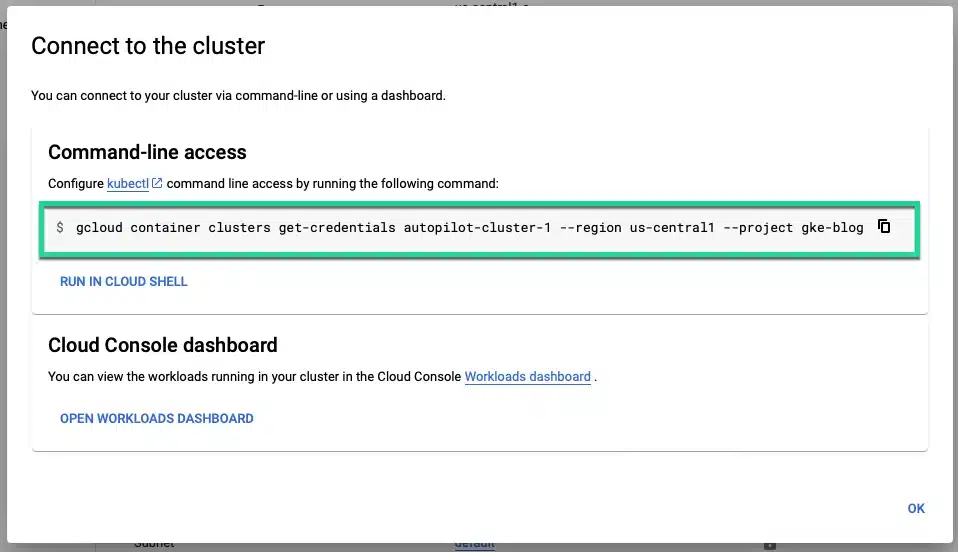
When the cluster is ready, install the gcloud CLI tool and connect to it by copying the connection string found in the connect dialog and paste it into your terminal.
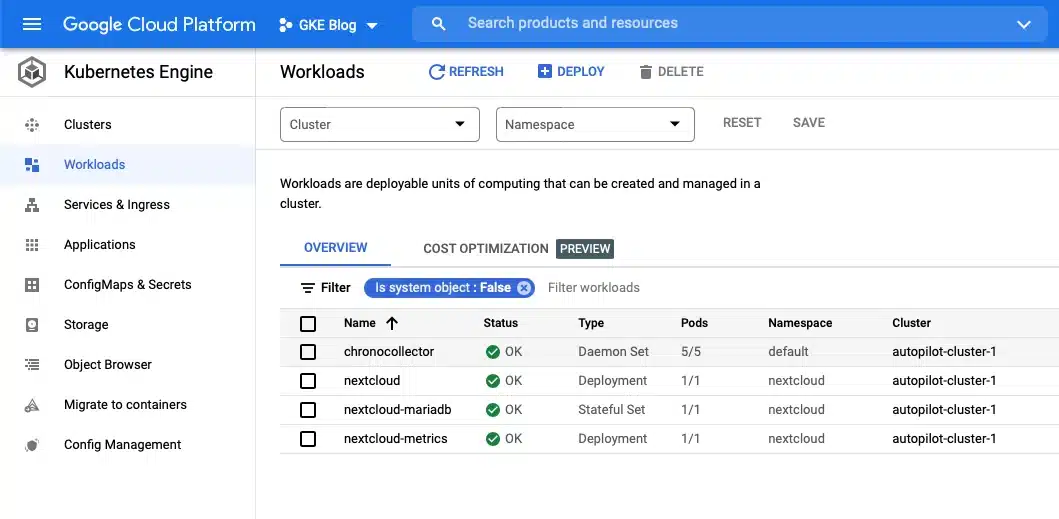
Create the resources for the Chronosphere collector using the YAML file from above and wait for the pods to become ready by watching the Workloads tab of the Kubernetes Engine menu item.
kubectl apply -f chronocollector.yamlCreate the resources for an application that reports Prometheus compatible metrics. This example uses a Nextcloud cluster with the Prometheus exporter.
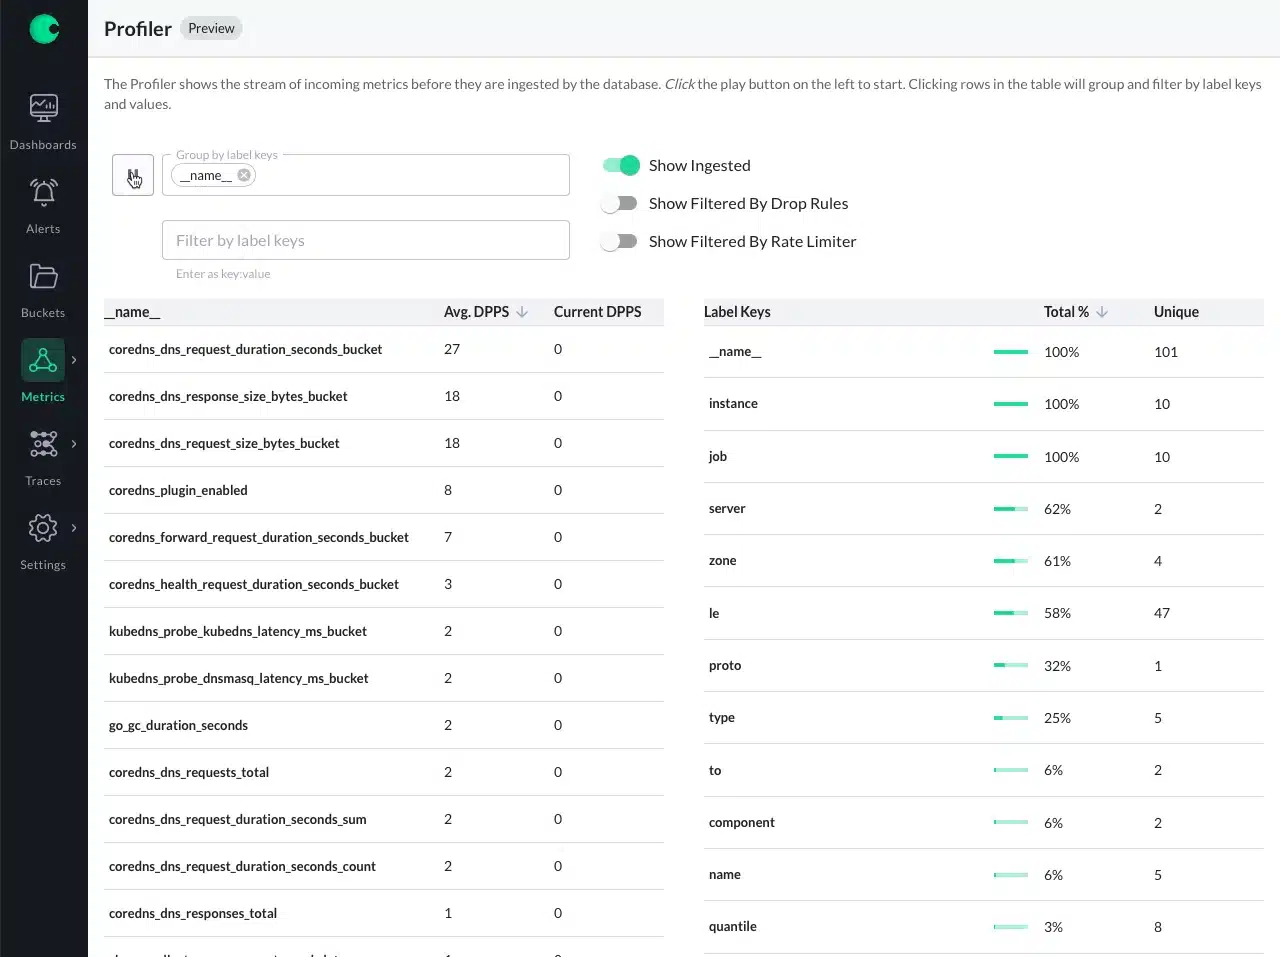
When all the pods for the application are ready, you can see the metrics Chronosphere is scraping using the Metrics profile (or any other section).
Next steps
Ready to learn more about how Chronosphere can help you monitor your GKE Autopilot clusters? Get in touch with an observability expert today.