The roles of observability and metrics
Distributed systems are inherently complex, and, as systems theorist Richard Cook notes, “Complex systems are intrinsically hazardous systems.” Distributed systems have many more moving parts. The constant struggle for high availability means that, more than ever, we need monitoring and observability built for the cloud native world.”
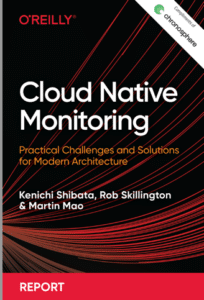
The new O’Reilly Media report Cloud Native Monitoring addresses this topic’s practical challenges and solutions for modern architecture in technical detail.
“The cloud native ecosystem has changed how people around the world work,” according to O’Reilly authors Kenichi Shibata and Chronosphere co-founders, Martin Mao (CEO) and Rob Skillington (CTO). Yet the dynamic, distributed architectures it has introduced are complex and more interdependent than ever, which “can cause them to fail in a multitude of ways.”
That makes it essential for organizations to not only consider metric data but to embrace an outcomes-focused approach to observability. Knowing, triaging, and understanding failures are at the heart of that mindset.
System builders want to measure what they know best, according to the authors, so they tend to ask about the kinds of metrics that will help them understand if something is wrong with the system and remediate it. However, they should be working backwards, from understanding what the best experience could be for a customer—whether that person is trying to browse a catalog or complete a transaction.
With clear outcomes, metrics become meaningful starting points. Because they show data measured over intervals of time, they can provide an efficient snapshot of the system and allow teams to aggregate data quickly.
How to harness growing metric data
Metric data growing at scale, especially in cloud native systems, has necessitated a move away from proprietary agent-based systems, note the authors, to open-source metrics. The biggest breakthrough was SoundCloud’s introduction of Prometheus. It allowed teams to instrument once and output everywhere. Rather than push-based, it initiated pull-based scraping of the metric endpoint that didn’t impact performance. As a result, metrics instrumentation became part of the app‚ not a separate process.
Widely adopted, Prometheus is a great way to get started with cloud native monitoring, but in scaling organizations it shows signs of buckling with the authors describing these four key challenges of Prometheus:
- Single point of failure
- Easily overloaded
- Hard to automate
- Limited scalability
To overcome these obstacles, being able to scale Prometheus horizontally has taken on new urgency as digital business accelerates. The report’s authors recommend fully managed services over self-managed options because of the associated hands-on exploration capabilities, a.k.a. heuristics. Among them are Prometheus conformance, operational integration, full observability feature sets, and reliability—all capabilities that leading observability vendors such as Chronosphere provide.
71% of IT, DevOps, and application development professionals call observability data growth rate alarming.
After explaining three metrics of cardinality classification types—high-value cardinality, low-value or incidental cardinality, and useless or harmful cardinality—the authors detail key approaches to an outcomes-based approach. These include retention, resolution, and aggregation which help control the growth of metric data, so organizations are only getting and keeping what counts as a way to speed outcomes.
The nuts and bolts of great metrics functions
Organizational context is key, the authors explain, which is why teams should rely on internal software engineers or site reliability engineers (SRE) and observability teams to build and create standardized dashboards. Examples of this are customizing how alerts are routed and tiering applications. “Service levels, which you can derive from your metrics, are a great way to align site reliability with your business goals,” they explain.
Other important steps to building great metrics functions, the authors agree, are:
- Monitoring the monitor — Separating the monitoring region from where infrastructure runs
- Setting write and read limits – Building a detection system to prevent outages
- Implementing safe ways to experiment and iterate – Using different observability platforms to innovate
Download the report
The three O’Reilly authors are clear that metrics are the keystone of cloud native observability and building a great metrics function is about finding the right strategy.
Help your organization get started on improving by boosting the way you manage and measure. Download the Cloud Native Monitoring report.
About the Authors
Kenichi Shibata is a cloud native architect at esure, specializing in cloud migration and cloud native microservices implementation using infrastructure as code, container orchestration, and host configuration management, and CI/CD. He has production experience in Kubernetes in a highly scalable and highly regulated environment.
Rob Skillington is the cofounder and CTO of Chronosphere. He was previously at Uber, where he was the technical lead of the observability team and creator of M3DB, the time-series database at the core of M3.
Martin Mao is the cofounder and CEO of Chronosphere. He was previously at Uber, where he led the development and SRE teams that created and operated M3.


