


After laying out the groundwork for this series in the initial article, I spent some time in the second article sharing who the observability players are. I also discussed the teams that these players are on in this world of cloud native o11y. For the third article I looked at the ongoing discussion around monitoring pillars versus phases. In the fourth article I talked about keeping your options open with open source standards.
Being a developer from my early days in IT, it’s been very interesting to explore the complexities of cloud native o11y. Monitoring applications goes way beyond just writing and deploying code, especially in the cloud native world. But one thing remains the same: Maintaining your organization’s architecture always requires both a vigilant outlook and an understanding of available open standards.
In this fifth article, I’m going to look at architectural choices you might encounter when older monolithic applications and monitoring tools are still part of an organization’s infrastructure landscape.
Having previously covered the virtues of open standards and less official commonly adopted standards in the open source o11y world, it’s now time to see how this same effect has been applied for monitoring older applications and services.
Not all cloud native
Not every cloud architecture can run only cloud native or Kubernetes workloads. Many still have older components, services, or applications that run as monoliths. These monoliths are not broken up into microservices, do not auto-scale in a container world, and might not even run in a container at all.
This does not preclude you from monitoring them in some fashion just as you would your cloud native workloads. In the past, this might have been done with the application performance management tools, but often required multiple tools.
So many options have been used over the years, and contrary to popular belief, not all architectures have moved on from monitoring their monoliths. We’ll always uncover dark corners of aging infrastructure that uses tooling we thought we’d never see again in the light of day.
Let’s explore a few of the options you are more likely to encounter as examples of how we can initially merge these aging efforts into our cloud native observability platform.
Some (aging) options
While you might find almost anything under the sun still running in the older corners of some infrastructure architectures, it’s going to be tough to cover them all. For example, I’m not going to talk about Nagios. It can be integrated in the same way as the options I’m going to cover below and I’m choosing to focus on examples that you’re more likely to encounter.
Let’s explore some of the solutions you will encounter for monitoring more traditional monolithic solutions and infrastructure: Graphite, statsD, and Collectd.
Graphite
This is an open source project first released in 2008 that provided a time-series metrics monitoring system. It was innovative in that it provided an original network-based approach to ingesting and handling metrics data from external systems without using the simple network management protocol (SNMP).
The basic architecture is pushing metrics from the monitoring targets using a client. This client must understand that the central server that collects the metrics can’t always receive and ingest data sent. The server ingests and stores the time-series data allowing you to query it to create your monitoring dashboards. Metrics are pushed to the Graphite server in plain text, or as a binary set of metrics using its own protocol.
For a more in depth look at the Graphite platform, there is an architecture and concepts overview here.
If you encounter this platform, there are options available from the open source project Prometheus, where you can use the Graphite exporter. This lets you integrate your existing monolithic applications and infrastructure metrics into your cloud native o11y efforts without an immediate migration effort.
StatsD
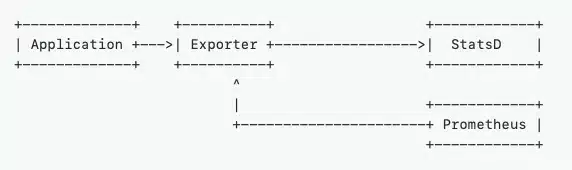
At one time, statsD was the most popular monitoring solution for instrumenting code and exposing custom application metrics. It’s open source and allows you to expose the inside of your monolithic applications and is very closely tied with the concepts of application performance monitoring.
Developers instrument their code using client libraries for whatever language they are using. There is a central statsD daemon that runs and pulls metrics, generates aggregated metrics, and relays them onwards to a monitoring or graphing backend (a favorite being Graphite). It uses user datagram protocol, which means a low communication overhead. It was very advantageous to have the metrics daemon detached from the application and therefore not ever crashing or affecting application performance.
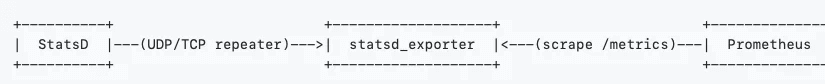
StatsD also has options available from the open source project Prometheus when looking to integrate that existing monolithic infrastructure into your cloud native o11y efforts. Integrating initially by using the statsD exporter from the Prometheus ecosystem avoids the need for an immediate migration effort.
Collectd
This is another metrics data collection solution with a plugin architecture of more than 100 options. Some common collectd plugins are CPU, memory, disk usage, aggregation, network traffic, NGnix, and MySQL. It is written in the C language for performance and portability, which means it can run on systems without a scripting language or cron daemons, such as embedded devices. It does need to be installed on every machine that it monitors as it uses a push mechanism to send its metrics to a backend system such as Graphite.
Integrating collectd into your modernization plans can also, you guessed it, be achieved using the collectd exporter. This gives you the time to leverage existing monolithic infrastructure in your cloud native o11y strategy and buy some time to plan for the eventual migration path.
Open path to cloud native
What exactly do the three examples discussed above have in common when we are looking to integrate aging monitoring infrastructure platforms and tools into our cloud native o11y strategy? They all have the ability to first be integrated by using open source monitoring solutions for cloud native environments.
Lucky for us, there are many options to ensure that you can mitigate these old dependencies without rip and replacing them. The open source world gives us the ability to ingest older metrics platforms, APIs, and other components that use a vast ecosystem of exporters. This gives you time for bringing your monoliths into the cloud native o11y world.
Next up, I plan to start exploring a new project called Perses. This is an up and coming open source metrics dashboard and visualization project where I start getting some practical experience in my cloud native o11y journey.
Check out the other articles in this series:
Part 7: Without observability, it’s just code
Part 6: Getting started with Perses
Part 4: Keeping your cloud native observability options open
Part 3: Cloud native observability needs phases
Part 2: Who are the cloud native observability players?
Part 1: Your first steps in cloud native observability


