Reduce log storage by over 70%? It’s possible.
One approach to logging is to keep everything in a searchable log management system. However, with the volume of logs produced by modern microservices, this approach can quickly become prohibitively expensive. Some organizations attempt to reduce costs by purging old logs on a set schedule, but this results in historical gaps.
Another approach is to keep only what is necessary or potentially useful and discard the rest. The first challenge there, though, is knowing what’s useful and what’s not. The second challenge is doing so before the logs are delivered to your storage and analysis endpoint, by which time you’ve already incurred the cost of ingesting them.
In this post, we’ll demonstrate how to use Chronosphere Telemetry Pipeline from the creators of Fluent Bit and Calyptia to process logs in-flight before they are routed and delivered to their destination.
We will first transform the logs from unstructured data into structured JSON to enable structured logging, which makes querying and analyzing the data easier once it is stored. Then while the data is still in-flight, we will identify which logs we want to keep and which we can safely drop, resulting in over 70% reduction in storage.
Getting started
If you are unfamiliar with the concept of telemetry pipelines you may want to start with this overview.
For the purpose of this blog, we’ll be utilizing the Processing Rules Playground feature within Telemetry Pipeline. The playground provides an environment to experiment with processing rule modifications non-destructively. You can import samples of your actual logs, allowing you to precisely gauge the impact of any modifications before implementing them in your live pipeline. Once you are satisfied with your processing rules in the playground, you can export them and apply them to your live pipeline.
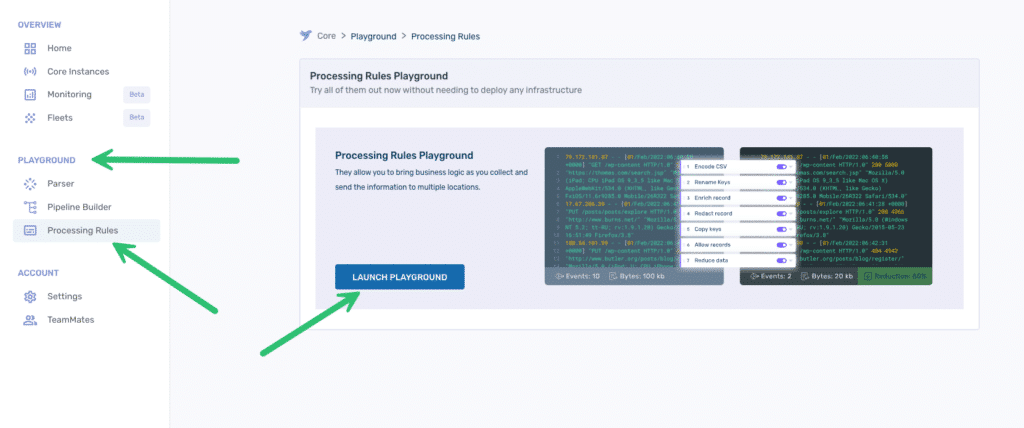
If you are following along, find the Processing Rules Playground in the navigation and click the Launch Playground button.
Transform the log data to enable structured logging
Anyone who has ever tried to query across a large dataset of unstructured logs knows how frustrating and time-consuming it can be to discover actionable insights. Implementing structured logging makes it easier and faster to search and find data across
For this post, we’ll use a sample Apache error log file from the Loghub project. The unstructured raw data looks like this:
[Sun Dec 04 04:47:44 2005] [notice] workerEnv.init() ok /etc/httpd/conf/workers2.properties
[Sun Dec 04 04:47:44 2005] [error] mod_jk child workerEnv in error state 6
[Sun Dec 04 04:51:08 2005] [notice] jk2_init() Found child 6725 in scoreboard slot 10
[Sun Dec 04 04:51:09 2005] [notice] jk2_init() Found child 6726 in scoreboard slot 8
[Sun Dec 04 04:51:09 2005] [notice] jk2_init() Found child 6728 in scoreboard slot 6
[Sun Dec 04 04:51:14 2005] [notice] workerEnv.init() ok /etc/httpd/conf/workers2.properties
[Sun Dec 04 04:51:14 2005] [notice] workerEnv.init() ok /etc/httpd/conf/workers2.properties
[Sun Dec 04 04:51:14 2005] [notice] workerEnv.init() ok /etc/httpd/conf/workers2.properties
[Sun Dec 04 04:51:18 2005] [error] mod_jk child workerEnv in error state 6
…
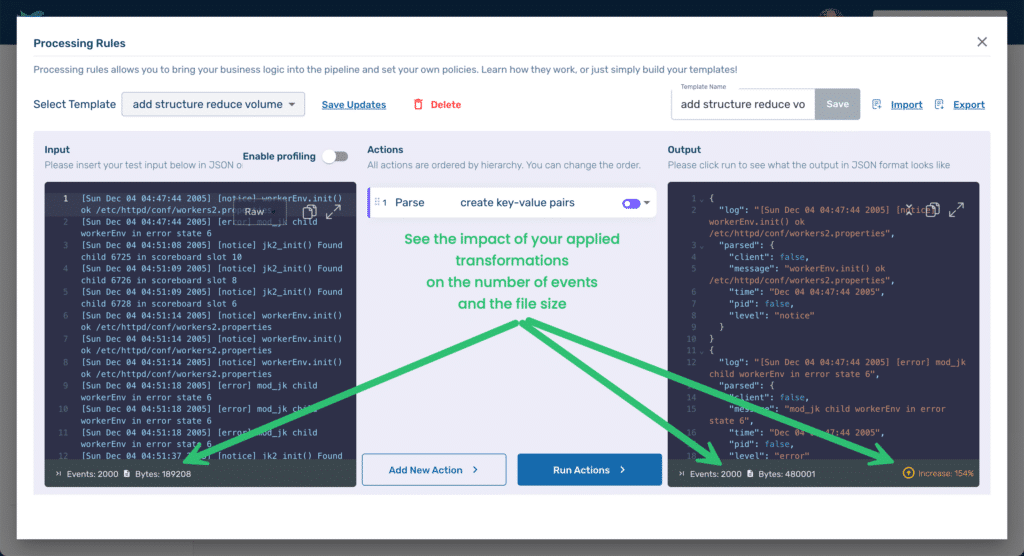
Copy the log file from the LogHub repo and paste it into the Input area of the playground replacing the existing sample data (see #1 below). We’ve not yet created any Processing Rules, but go ahead and click the Run Actions button (#2) to see how Telemetry Pipeline handles data by default.
As you can see in the Output area (#3), by default Telemetry Pipeline returns the data as a JSON file with a single key-value pair with the key being log and the value being the entire event.
{
  "log": "[Sun Dec 04 04:47:44 2005] [notice] workerEnv.init() ok /etc/httpd/conf/workers2.properties"
}
{
  "log": "[Sun Dec 04 04:47:44 2005] [error] mod_jk child workerEnv in error state 6"
}
{
  "log": "[Sun Dec 04 04:51:08 2005] [notice] jk2_init() Found child 6725 in scoreboard slot 10"
}
{
  "log": "[Sun Dec 04 04:51:09 2005] [notice] jk2_init() Found child 6726 in scoreboard slot 8"
}
…
While the data is now technically structured, the structure is not particularly useful! However, with the addition of a few processing rules we can change that.
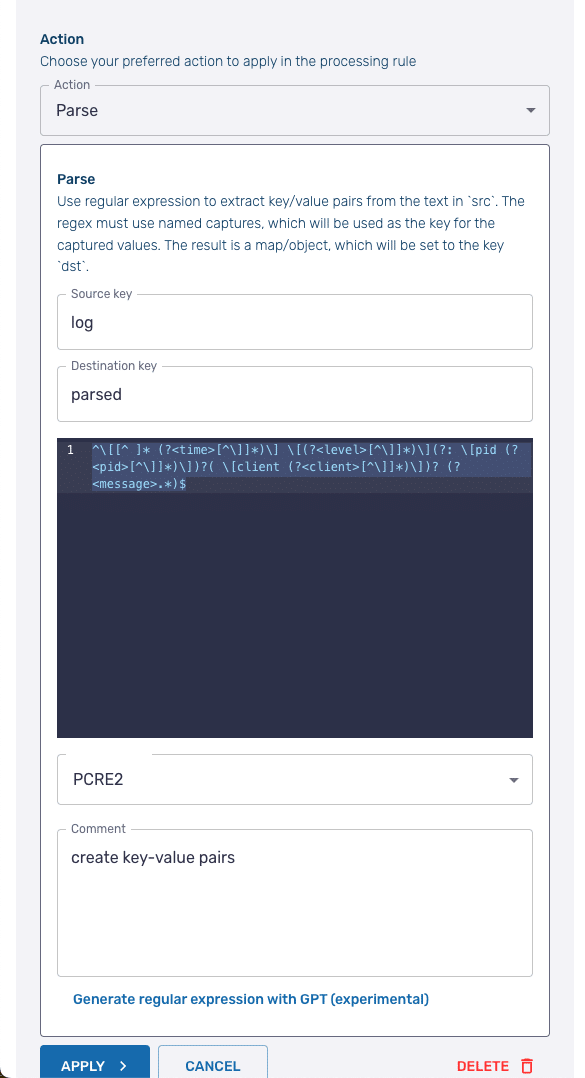
Click the Add New Action button and then from the dropdown select Parse. The Parse processing action applies a regular express (regex) to a designated value to create key-value pairs from the value of the original key.
For the Source key enter log. Leave the Destination key with the default value of parsed.
In the text block area, add the following regex:
^\[[^ ]* (?<time>[^\]]*)\] \[(?<level>[^\]]*)\](?: \[pid (?<pid>[^\]]*)\])?( \[client (?<client>[^\]]*)\])? (?<message>.*)$The regex is the one used by Fluent Bit to parse Apache error logs and is available in the project’s repo.
Press Apply to create the rule, and then Run Actions to see the results of the transformation, which should like this:
{
  "parsed": {
    "time": "Dec 04 04:47:44 2005",
    "client": false,
    "message": "workerEnv.init() ok /etc/httpd/conf/workers2.properties",
    "level": "notice",
    "pid": false
  },
  "log": "[Sun Dec 04 04:47:44 2005] [notice] workerEnv.init() ok /etc/httpd/conf/workers2.properties"
}
{
  "parsed": {
    "time": "Dec 04 04:47:44 2005",
    "client": false,
    "message": "mod_jk child workerEnv in error state 6",
    "level": "error",
    "pid": false
  },
  "log": "[Sun Dec 04 04:47:44 2005] [error] mod_jk child workerEnv in error state 6"
}
{
  "parsed": {
    "time": "Dec 04 04:51:08 2005",
    "client": false,
    "message": "jk2_init() Found child 6725 in scoreboard slot 10",
    "level": "notice",
    "pid": false
  },
  "log": "[Sun Dec 04 04:51:08 2005] [notice] jk2_init() Found child 6725 in scoreboard slot 10"
}
…
Now we have structured data where the structure is useful with new key-value pairs for keys time, client, message, level, and pid.
However, by adding structure, we have also significantly increased the size of our log files. The Processing Rules Playground calculates the impact of the applied rules. At the bottom of the Input area, we can see that there were 2000 events in the original file, and the file size was 189,208 Bytes. At the bottom of the Output area, we can see that while we still have 2000 events, our file size has increased to 480,001 Bytes, an increase of 154%.
However, we can significantly reduce the size by applying a couple of processing rules that identify which data is actually useful to us.
Reducing the file size impact of structured logging
You’ll notice that each event of our output consists of two parent keys — parsed and log — with time, client, message, level, and pid being children of parsed and the value of log still containing the entire original event.
The log key-value pair is redundant since we have extracted the value and applied structure to it. To remove it, Add New Action and select Block keys from the dropdown. As the name implies, Block keys allows us to remove keys that match a regex expression we provide. In the Regex field just enter log since we want a literal match. Apply the rule, and then Run Actions to see the results.
{
  "parsed": {
    "time": "Dec 04 04:47:44 2005",
    "level": "notice",
    "client": false,
    "message": "workerEnv.init() ok /etc/httpd/conf/workers2.properties",
    "pid": false
  }
}
{
  "parsed": {
    "time": "Dec 04 04:47:44 2005",
    "level": "error",
    "client": false,
    "message": "mod_jk child workerEnv in error state 6",
    "pid": false
  }
}
…
The redundant log key-value pair has been removed, and according to the Telemetry Pipeline’s calculations, our output is now 294,792 Bytes, still 56% higher than original but a significant reduction from before we applied the Block key rule.
We can make one additional transformation to the structure of our output to further reduce its size by eliminating the parsed key’s unnecessary parent-child hierarchy.
Add a new action and select the Flatten subrecord. For the key field, enter parsed and keep the Regex and Regex replacement fields set to the default values.
Once we run the action we are at 272,792 Bytes, a 44% increase over the original size, and our output looks like this:
{
  "message": "workerEnv.init() ok /etc/httpd/conf/workers2.properties",
  "pid": false,
  "level": "notice",
  "time": "Dec 04 04:47:44 2005",
  "client": false
}
{
  "message": "mod_jk child workerEnv in error state 6",
  "pid": false,
  "level": "error",
  "time": "Dec 04 04:47:44 2005",
  "client": false
}
…
Reducing logging volume by applying business logic and policies
Now that we have perfectly structured logs, we can start applying processing rules that reflect our business needs and policies. For example, if we are retaining Apache error logs in order to assist in troubleshooting problems, then we may not need to retain notice-level messages.
Remove unnecessary data
To identify and remove notice-level messages Add a Block records rule and set the Key field to level and the Regex field to notice. After running our new rule, we have eliminated all but 595 events from our output and have reduced the storage required to 76,062 Bytes, a 60% reduction from the original unstructured log.
Tip: Create a rule to catch debug-level errors to avoid unexpected spikes in storage costs caused by a developer inadvertently leaving debug on after troubleshooting a problem.
If you examine our current output, you may notice that the value of pid is always false. This may be because the Apache server was not configured to emit the process id (pid). While that may seem strange, if the company is okay with it as a policy there is no need to store data that will never have a value. Create another Block keys rule like we did earlier to remove the log key-value pair but this time blocking the pid key-value pair and apply it. A small reduction, but we are now at 64% of the original size.
Tip: You may be tempted by our sample dataset to apply the same logic to the client key since a quick perusal seems to indicate that it is also always false—in fact, it is not. Before making decisions to drop data make certain that the server is intentionally configured to omit certain settings and that values that appear not to change in fact never change.
Remove duplicate data
Another possibility for reducing the log data you retain is to dedupe it. In some cases, this may mean only data that is exactly the same and was inadvertently collected twice due to some hiccup.
Another possibility, though, is dropping multiple messages alerting about the same error over a particular timeframe. The data is not an exact duplicate — the timestamp would differ between two messages. However, the information that you glean from the data is the same — e.g. the application is still having problems.
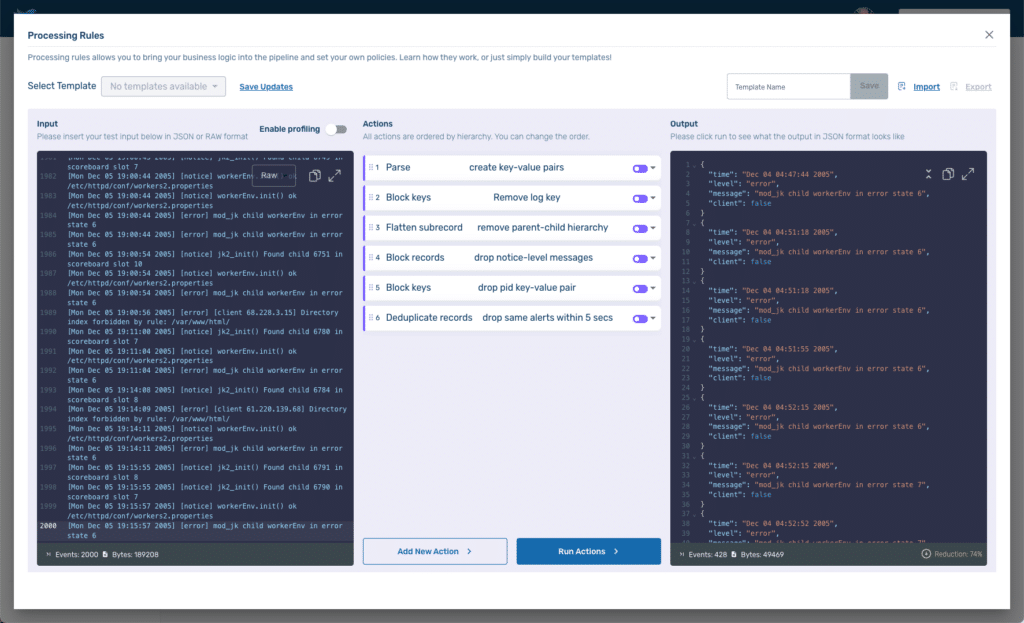
To solve for this, add a new rule, and select Deduplicate records. We’ll enter 5 (for five seconds) in the Time window field and message in the Select key field. This will drop any records with the same message as a previous message received less than 5 seconds before.
We are now down to 428 events and 49,469 Bytes, a 74% reduction!
Learn more
In a matter of minutes, we used Telemetry Pipeline to create and apply complex processing rules to our logs that transformed unstructured log events into structured data. Using our newly structured logs, we were able to identify which logs we wanted to keep for future use and discarded the rest, significantly reducing our storage volume and costs.
These are just a few examples of how Telemetry Pipeline can help you meet the challenges of modern log management.
To better understand those challenges, check out this episode of the Chronologues podcast where host Sophie Kohler chats with Chronosphere’s Head of Product Innovation Alok Bhide, and Field Architect Anurag Gupta, as they walk through what we’re hearing from customers and how to successfully manage logs while avoiding high costs.


