


Give events a chance; knowing what changed is essential to identifying and resolving problems.
During a meeting last year with top observability leaders from various cloud native businesses, I posed the question: “Which type of telemetry: metrics, events, logs, traces, is your least favorite?” I was fairly certain logs would top their list. Not that there’s anything inherently wrong with logs, but a member of this group recently said, “during an incident, if you’ve gone to the logs, you’ve already failed,” and got a lot of head nods.
Wow, was I off the mark. The consensus was clear: events were the most disliked telemetry type. I probed further to better understand WHY they hated events so much. The response was almost unanimous again: The lack of clarity around the definition of an event and how to use them.
I understand the confusion. In my own research on events, I’ve encountered four to five varying definitions, with no clear consensus on how to integrate them into a break/fix workflow.
Since that discussion, our team has dedicated considerable effort to rethinking events and how to make them more useful in a troubleshooting workflow. After thorough research, we’ve developed and recently introduced the ability to integrate change events into our observability platform.
Let’s take a quick moment to reassess the importance of events and how you can use them to solve problems faster.
Since that meeting, our team has spent a lot of time thinking about events and how we can make them useful as a first-class telemetry citizen. The team did extensive research and then got to work building a function to track change events. Just recently, we announced the ability to ingest events in our observability platform.
I want to step back and explore why events are so critical and how they can help.
Events pinpoint which changes caused the issue
Change is the primary source of errors. In a fixed state where nothing changes, a system will perform reliably around the clock. Yet, in the fast-paced realm of modern DevOps, our systems change constantly. We introduce new code, activate or deactivate feature flags, deploy new infrastructure, scale up and down, and occasionally switch observability tools. Similarly, business conditions are constantly changing, influenced by the time of day, the day of the week, seasons, global events, competition, and countless other unpredictable factors.
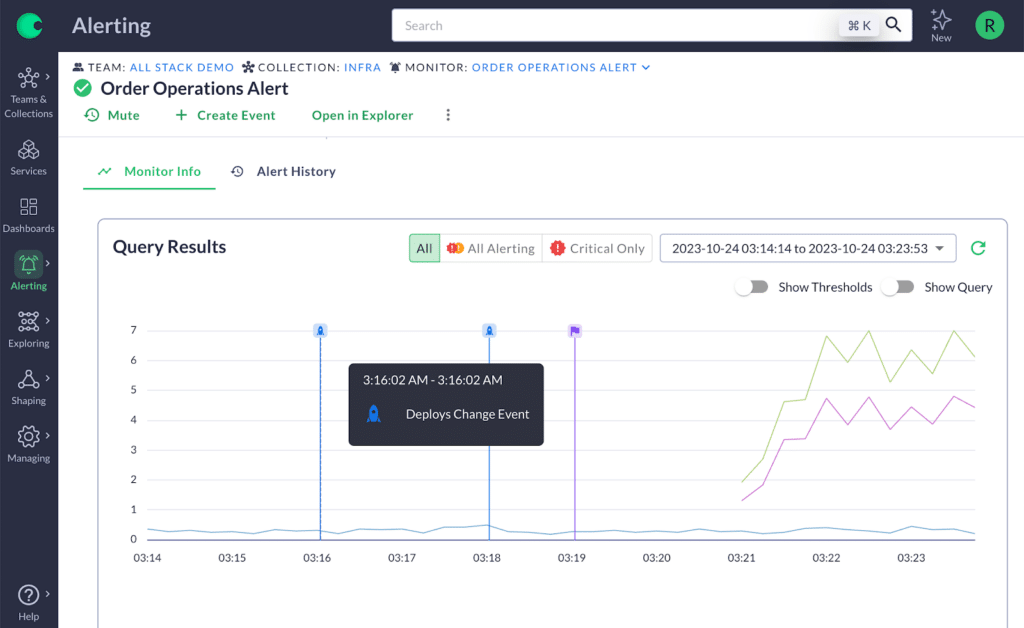
Any time an alert fires, the responder will immediately want to know what caused it. And nine times out of ten, that was a change to the environment. To stay on top of these changes, you need a way to link the changes into the broader context of the alert and metrics. This is what we call an event in Chronosphere.
Telemetry events and event types defined
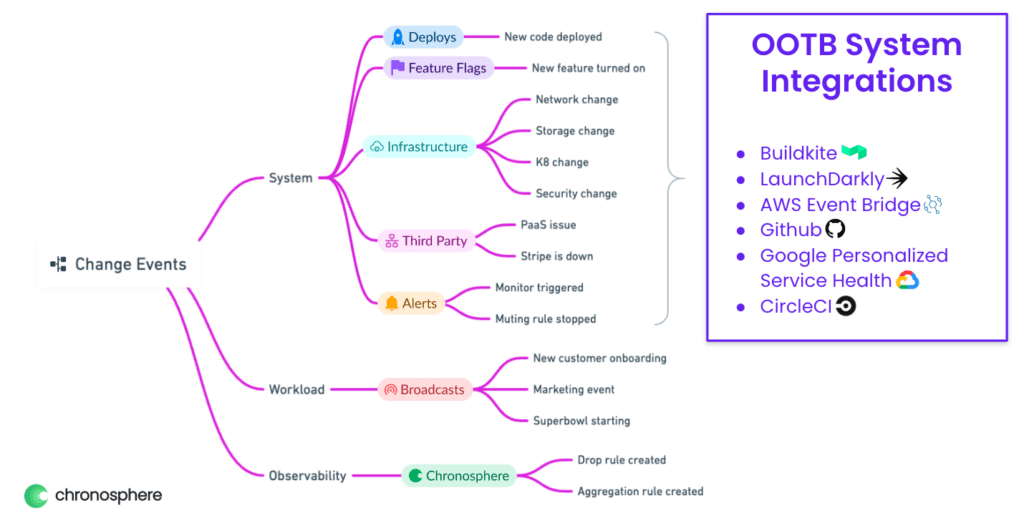
An event is a discrete change to a system, a workload, or an observability platform. Here are a few types of events and how they can help you troubleshoot issues:
- System change: These are changes to the underlying systems and infrastructure. Examples include an autoscaling action, a configuration update, or a change in a feature flag. While these changes can be tracked through CI/CD tools, feature flag systems, or infrastructure management platforms, this process is often time-consuming. By linking the infrastructure change directly to the observability platform, developers can quickly see when a recent deployment, for example, is directly linked to an error.
- Workload change: These changes are often overlooked and can easily become a blind spot for organizations. For instance, adding a new customer or a business event such as a company-wide sale can be considered workload changes. By combining these events with other telemetry data, teams can skip unnecessary investigations and cut down on redundant conversations on Slack, especially when trying to figure out why the telemetry data looks different even though nothing seems to have changed in the system.
Observability platform change: These include events such as an alert being fired or muted, or a new data aggregation rule that alters the structure of the data. These changes may cause the data shape to change, and could easily cause confusion.
Where do events fall within the telemetry landscape?
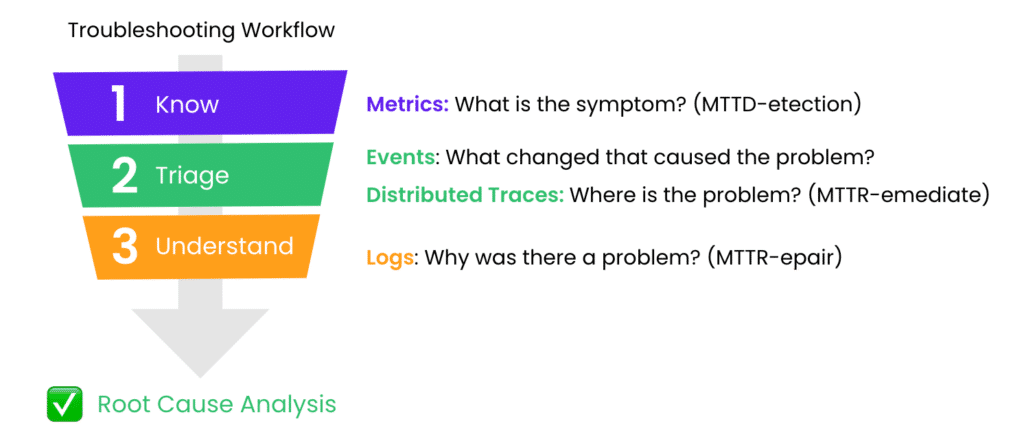
Events play a crucial role in the observability framework, complementing metrics, traces, and logs in the troubleshooting process. Metrics show the symptoms of a problem and are essential for quickly spotting issues (MTTD). Tracing helps in locating the issue, and events assist in resolving the disruption and alleviating customer distress. After that, diving into logs helps uncover why the issue happened, leading you to the root cause so you can fix the underlying problem.
This method is known as the three phases of observability: identifying an issue, triaging, and understanding it, all aimed at expediting the remediation process.
Unlock the true potential of events
I originally titled this piece “In Defense of Events” to highlight their importance and encourage you to see their potential. Events add valuable detail to your existing telemetry and can help bring essential context into your alerts quicker.


