Kubernetes Workload Observability Simplified
Gain unparalleled visibility and control with Chronosphere Observability Platform. Purpose-built for containerized infrastructure and applications, it empowers you to optimize performance, simplify operations, and scale confidently—without compromising on efficiency or cost.

Challenges: The Complexities of Monitoring Kubernetes Workloads
Kubernetes has revolutionized application deployment and scaling, but it brings unique challenges for observability, requiring modern solutions designed to handle its dynamic nature.
Unprecedented Volume of Telemetry Data
- Kubernetes environments generate 10-100x more telemetry data compared to legacy virtual machine-based infrastructures.
- Each pod, service, and node emits high-cardinality metrics, creating a data explosion compared to static virtual machines.
- Traditional monitoring solutions can’t effectively manage the explosion of data, leading to delays, dropped data, or prohibitive storage costs.

Pods and Nodes Are Constantly Changing
- Kubernetes dynamically scales workloads, spinning up and down pods based on demand. Traditional monitoring tools struggle to keep up with this level of fluctuation, leading to blind spots or outdated telemetry data.
- Most monitoring tools weren’t built to handle these constant changes. As a result, costs can rise due to billing models that fail to align with the dynamic nature of these environments. Additionally, developers may face challenges troubleshooting efficiently due to user-experiences that are designed for more centralized, static workloads that do not translate well to containerized workloads.

Dynamic Relationships Between Services
- Microservices in Kubernetes environments constantly interact and evolve, making it difficult to map dependencies and identify bottlenecks.
- Distributed tracing tools often make it challenging to gain useful insights because of how difficult it is to set effective trace sampling strategies.

Cost
- The sheer scale of telemetry generated by Kubernetes workloads significantly impacts monitoring costs.
- A significant portion of the generated data goes unused. Most observability tools lack robust capabilities to identify and/or eliminate unnecessary data, so companies often pay for observability data that provides no real value.
How the Chronosphere Observability Platform Helps
Chronosphere was purpose-built to address these challenges. It simplifies Kubernetes observability at scale while enabling performance optimization and cost efficiency.
Unprecedented Volume of Telemetry Data
- Control Data Volumes: The Chronosphere Control Plane provides a suite of tools to identify and eliminate low value telemetry to reduce noise and prevent data overload.
- Scalable Infrastructure: Handles the exponential growth of telemetry data and ensures data is processed without delays.

Pods and Nodes Are Constantly Changing
- Auto-Discovery of Dynamic Workloads: Chronosphere Lens automatically detects and monitors ephemeral workloads. Integrated Change Events provide context on how workloads change over time.
- Real-Time Telemetry Streaming: Captures and processes telemetry data in real time to prevent blind spots, even as workloads fluctuate.
- Retention and Aggregation: Ensures critical performance data is aggregated and retained, so short-lived pods don’t disappear without leaving actionable insights.
Dynamic Relationships Between Services
- Centralized Tracing Control
- Use Trace Datasets to track and segment workloads. Prioritize sampling based on the importance of each to the business.
- Centrally manage dynamic head and tail sampling to ensure only high value traces are captured.
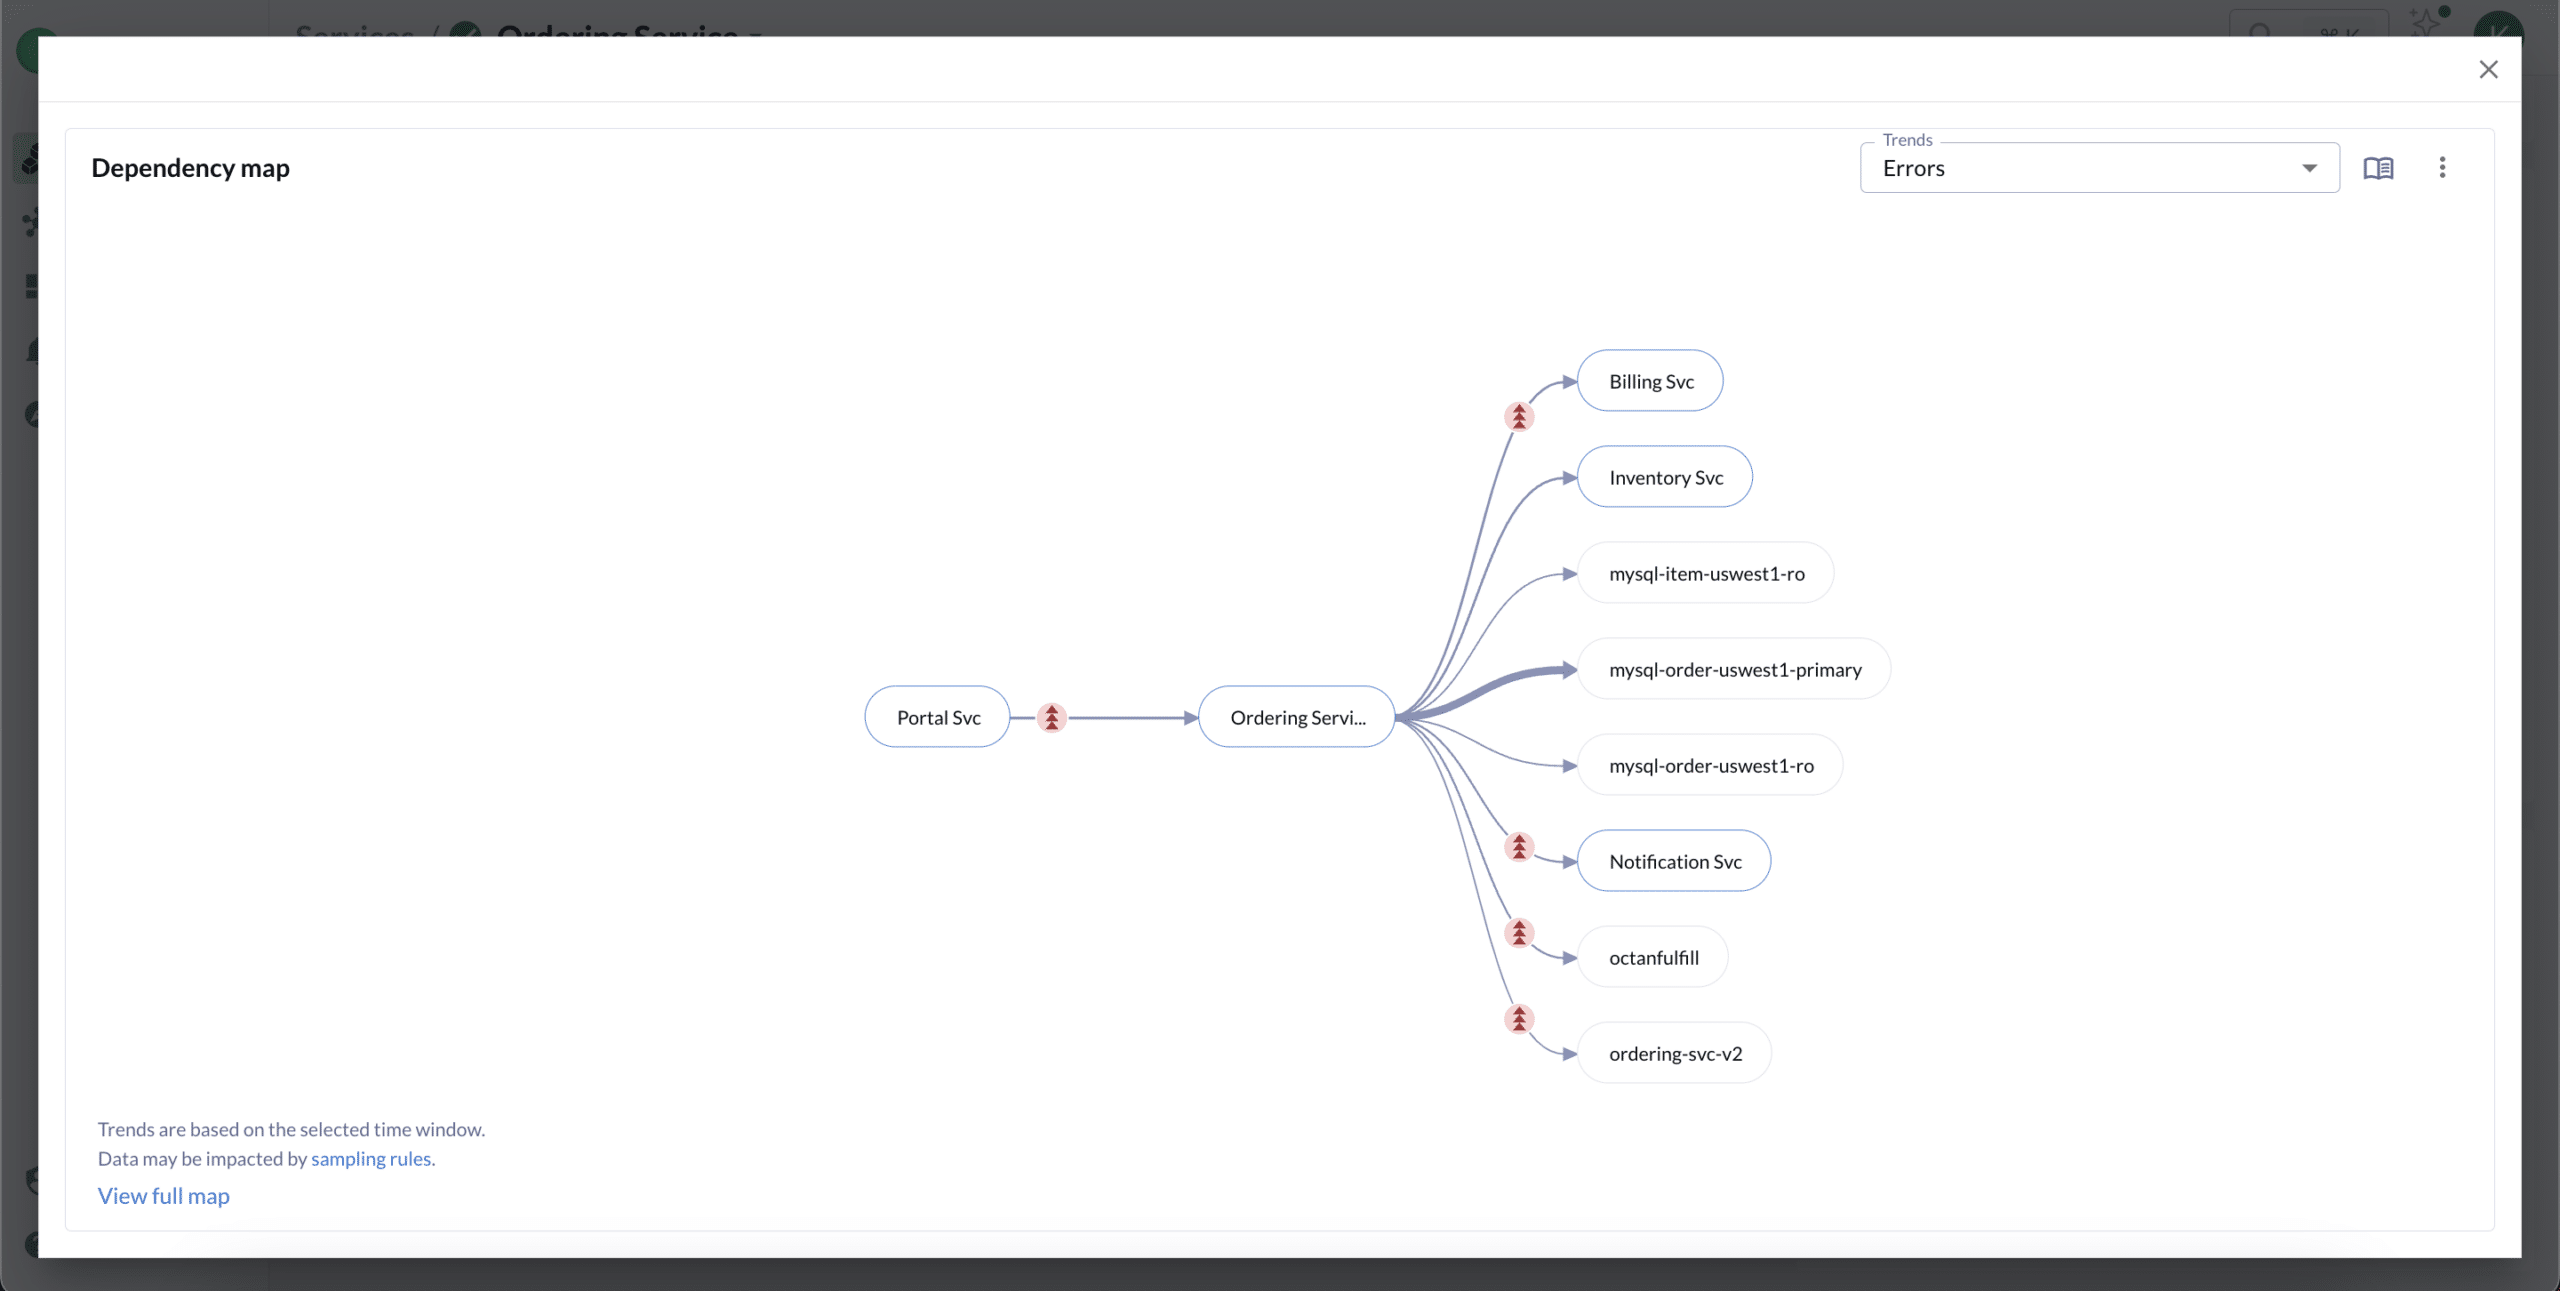
- Trace Explorer: Enables deep analysis of distributed traces to map dependencies and identify bottlenecks across dependent services.
- Differential Diagnosis (DDx): Provides a queryless, intuitive interface for investigating service relationships and identifying the root causes of performance issues.
- Service Dependency Visualization: Highlights the relationships between microservices to simplify troubleshooting and reduce the time to resolution.


Cost
- Intelligent Metric Optimization: Chronosphere’s Control Plane reduces telemetry costs by enabling orgs to easily identify and eliminate redundant or irrelevant metrics and refine data collection strategies.
- Dynamic Sampling for Tracing: Reduces storage and processing costs for trace data by capturing only the most valuable spans at both the head and tail of requests.
- Transparent Cost Management: Provides detailed visibility into telemetry resource consumption, empowering teams to align observability costs with business goals.

Support For All Major Kubernetes Platforms
Chronosphere supports all major Kubernetes distributions, including, but not limited to, self-managed Kubernetes, Amazon Elastic Kubernetes Service (EKS), Azure Kubernetes Service (AKS), Google Kubernetes Service (GKE), Red Hat OpenShift, and Rancher Kubernetes Engine (RKE).
Proven Results
Average Telemetry Data Volume Reduction
Reduction In Critical Incidents
Historically Delivered Uptime