Summary
The Chronosphere Control Plane right sizes metrics, logs, and traces to reduce costs, improve responsiveness, and boost signal-to-noise. This article focuses on metrics.
Cloud-native environments generate significantly more observability data than traditional VM environments. This scale often leads to sudden metrics cardinality spikes that drive up costs in massive, unpredictable ways. Chronosphere enables teams to optimize metrics by 89% on average while ensuring developers maintain access to high-signal data. This article explains how.
What causes massive spikes in metrics cost?
Cloud-native architectures have fundamentally changed how development teams work. By breaking up large, monolithic systems, you create smaller, independent components that are easier to update, maintain, and scale. While this modularity increases agility, it also creates a massive observability tax.
In containerized and microservices-based environments, each component creates roughly the same amount of metrics data as its VM counterpart. This means significantly more data and higher costs.
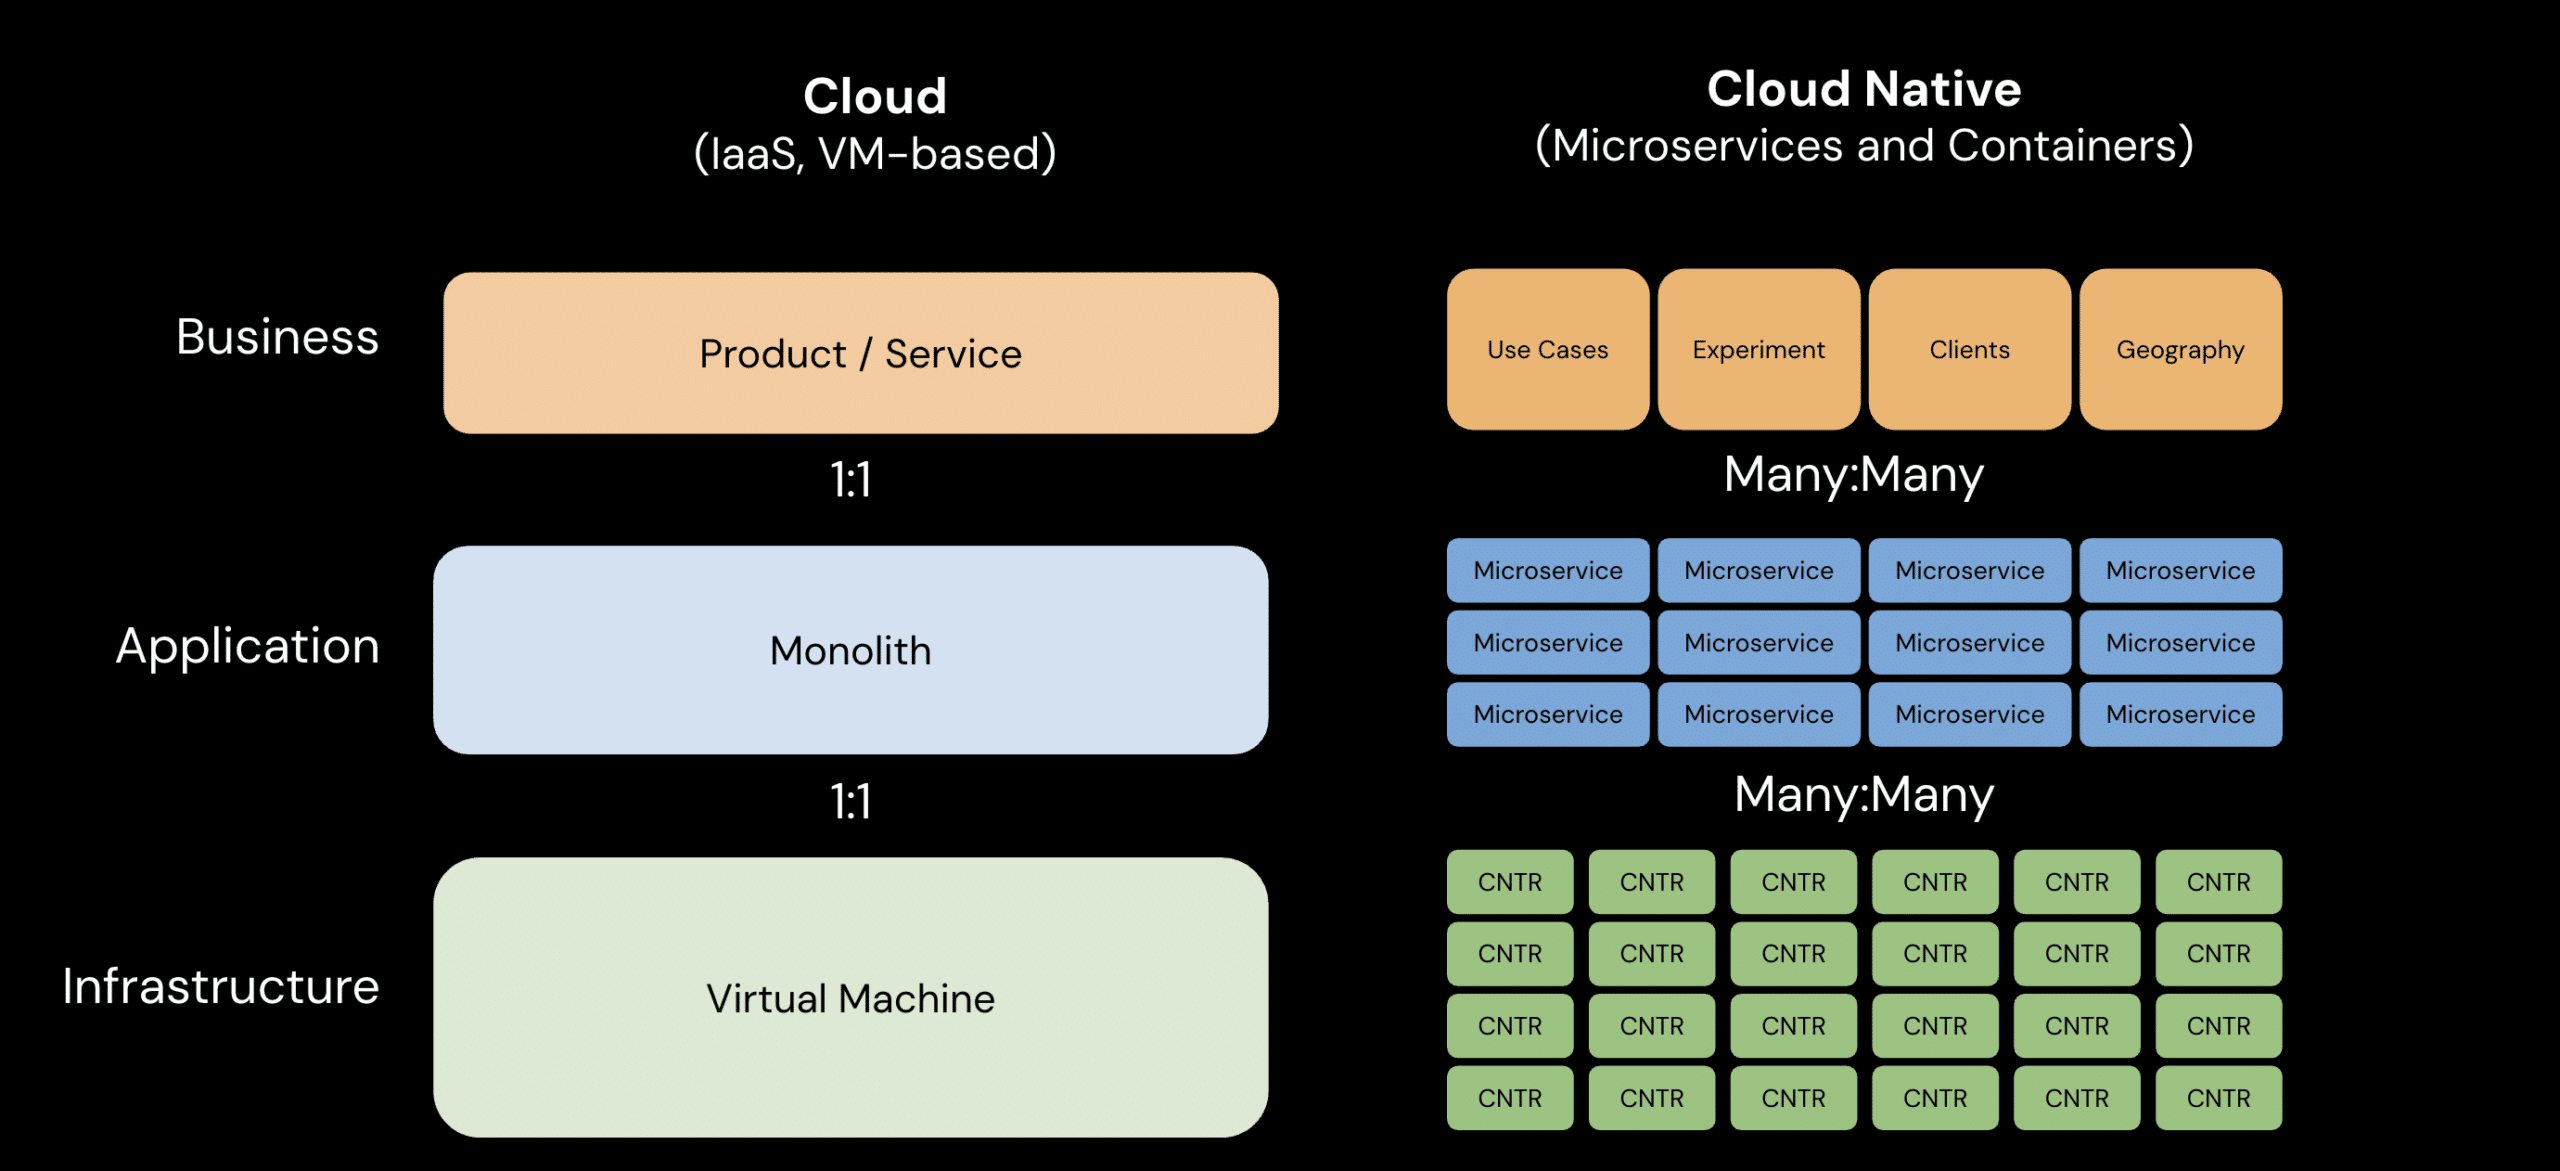
In cloud-native environments, each component generates roughly the same amount of metrics data as its VM counterpart, creating a massive spike in total volume.
Moreover, spikes are unpredictable. A developer’s small instrumentation change can unintentionally trigger massive data explosions and cost spikes that are often only discovered after the fact. When costs spiral, teams often launch reactive data-reduction projects. This means engineers dedicate sprint time to right-sizing metrics ingestion – not focusing on innovation.
These projects don’t solve cost problems in a sustainable manner because the teams running them lack visibility into which data is actually useful to monitoring and troubleshooting. Developers use a fraction of the data their systems generate. But, having access to the right data can be the difference between an issue that’s quickly resolved and an incident that significantly impacts revenue. So how do you know which is the right data to keep? Removing instrumentation blindly creates the risk that developers sacrifice the metrics or labels they need to keep systems up and running.
Chronosphere Control Plane solves these problems. It enables teams to capture the high-signal metrics needed for monitoring and troubleshooting, so developers no longer have to choose between a budget cap and visibility.
Day 0: Clear the low-hanging fruit with Recommendations
Gaining control over a bloated telemetry environment starts with addressing the most obvious waste: data that is never actually used. This is your “Day 0” priority: clearing out the low-hanging fruit to see immediate impact on your observability spend.
Chronosphere Recommendations automatically identifies metrics and labels that have shown zero usage or utility over the past 30 days. Before you commit to a change, you can calculate the estimated impact on persisted writes and cardinality directly within the interface. This allows you to verify exactly how much volume you will save before applying the optimization.
Once reviewed, you can generate a Drop Rule with a single click, ensuring that the identified metrics are no longer persisted to storage. This immediate removal of unused signals stops the monetization of waste without any risk to your current workflows.
Understand the value of all your metrics data with Metrics Usage analysis
Once unused data is removed, the next phase of optimization requires a deeper analysis about the value of the metrics you’re collecting.
It’s become more common for observability vendors to provide some transparency into which data is used versus unused. Often, they only provide this insight for a portion of your metrics footprint. While this information can help you make a dent in your observability spending, it doesn’t entirely solve your cost problem.
Truly right-sizing your metrics footprint requires you to beyond “used versus unused” and answer the following questions across every metric you collect:
- Is this metric or label being queried?
- How is it being queried?
- How frequently?
- By whom?
Why does this level of granularity matter? Let’s say we’re collecting a metric with a high data points per second (DPPS). It was queried 3 times before – all by the same person 8 months ago. Other vendors would flag this as a metric your team uses. But with deeper visibility, we know that it’s not important to our observability practice and can be safely dropped.
Chronosphere Metrics Usage provides this level of analysis across every metric in your system, down to individual labels. A key part of this analysis is the Utility Score. This score is an aggregate number indicating relative usefulness determined by:
- Configuration References: Explicit mentions in dashboards, monitors, recording rules, and shaping rules.
- Direct Query Executions: Activity from Metrics Explorer, external sources, and unique users.
- Unique Users: A metric used by more unique users receives a higher utility score than one queried many times by a single user.
By identifying metrics with high DPPS but low utility, teams can confidently prune their data for long-term cost savings. For example, the metric container_memory_swap might show high volume and thousands of unique label values, yet have a utility score of zero. Identifying these signals allows you to reshape your data strategy without impacting the developer experience.
Go beyond dropping data: shape and optimize
Chronosphere offers multiple ways to reshape data rather than simply deleting it. This allows teams to retain the signals that deliver the most visibility per dollar spent.
- Drop Rules omit incoming metrics based on specific labels or values before they are stored.
- Rollup Rules reduce the cardinality footprint by dropping unneeded labels—like instance or pod—after the metrics are sent but before they are stored. This keeps the analytical value of the metric while removing the high-cost, high-cardinality labels that aren’t needed.
- Mapping Rules downsample in-memory metric data on the streaming ingest path before it is stored. For example, you might be scraping a metric every 5 seconds, but not need that level of granularity. Mapping Rules can help you reduce the resolution, scraping every 60 seconds instead.
These rules are applied centrally, meaning your team doesn’t need to change instrumentation or redeploy services.
Reduce cost, boost signal, and improve query responsiveness
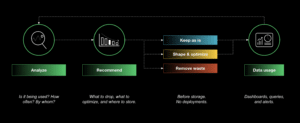
This diagram explains how the Chronosphere Control Plane works to ensure you capture the right metrics data while dramatically reducing costs.
Let’s summarize our approach. Chronosphere actively analyzes how your team uses observability data. With this analysis, Recommendations surface low-hanging fruit – data that is never queried – to remove for immediate cost savings. For data with non-zero activity, the Usage Analyzer helps you understand the true value of the rest of your data. From there, you can apply Optimization Rules to right size your data footprint.
Along the way, Chronosphere’s Customer Success team takes a white-glove approach, helping you be successful on your cost optimization journey.
By optimizing for high-value data, Chronosphere customers ensure developers always have access to high-signal data when they need it most. At the same time, customers achieve an average 89% reduction in metrics data volume. This efficiency allows organizations to invest more in visibility where it is needed and spend less time fighting to justify their observability costs.