



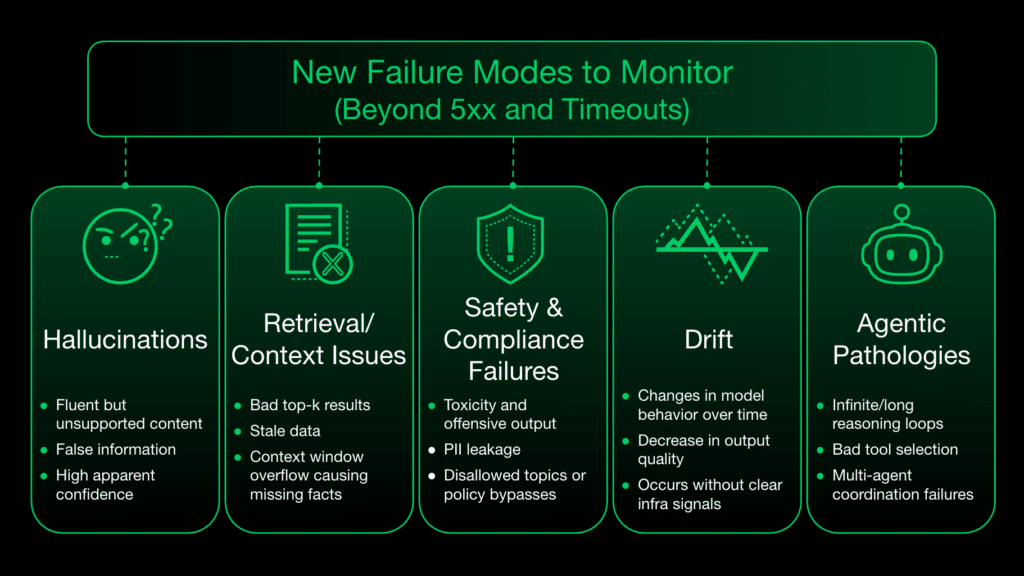
Direct LLM calls and autonomous agents both prove that standard observability measures—like uptime and latency—aren’t enough. These workloads introduce entirely new failure modes that traditional monitoring misses: from hallucinations and context window overflows to infinite reasoning loops and bad tool selection. A fast response is still a failure if it’s ungrounded, and a multi-step agent loop can succeed technically while failing logically.
Safely running these AI workloads in production requires connecting technical performance with output quality: tracking token costs to block runaway spend, semantic evaluations to catch accuracy regressions, execution traces to debug agent logic, and tool-call reliability across external dependencies.
How to use Chronosphere for Monitoring & Troubleshooting LLM and Agentic Workloads
Once your metrics and traces are flowing, you can use Chronosphere to identify and resolve the specific failures that occur in agentic environments. Here are three examples of how you can use the platform to troubleshoot your LLM and agentic workloads.
Managing the Unit Economics of AI
Scaling LLM-powered applications requires precise control over “unit economics”—the direct relationship between token consumption, model performance, and cost. Without real-time visibility, an inefficient agentic loop or a spike in high-latency model calls can lead to significant unforecasted spend.
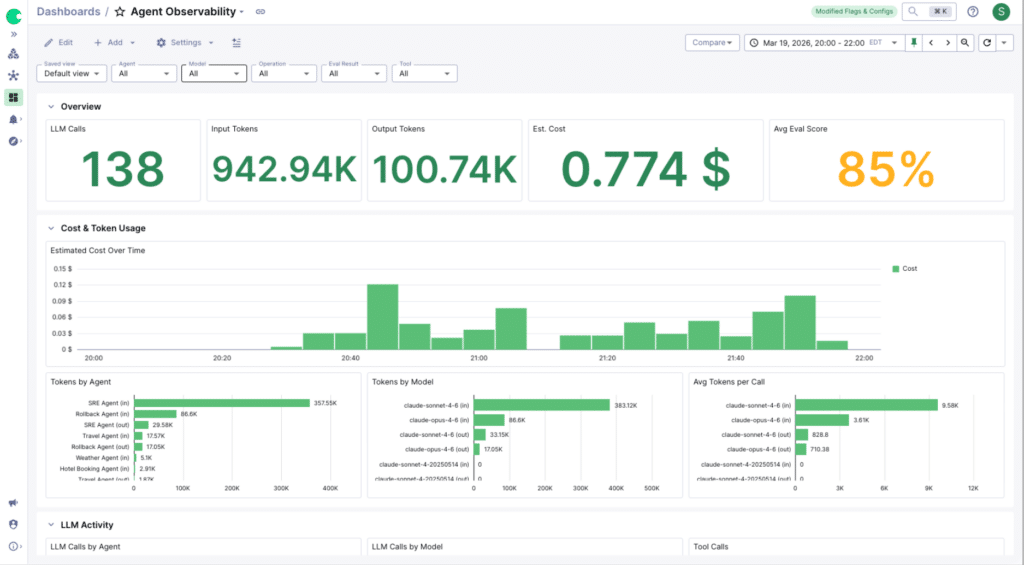
Chronosphere enables teams to build a centralized view to monitor and manage these financial and technical metrics. With support for OpenTelemetry GenAI standards, Chronosphere provides real-time visibility into performance, usage, and cost, including input tokens, output tokens, and total spend, broken down by model, such as Claude Opus or Sonnet
Beyond aggregate spend, these dashboards enable teams to filter activity by specific agents or versions. This visibility is essential for comparing the efficiency of different architectures. If a new version of an agent begins consuming significantly more tokens without a measurable increase in task accuracy, teams can identify the regression immediately. By contrasting technical metrics and financial impact, Chronosphere allows organizations to proactively manage costs and ensure that autonomous behavior remains within defined operational guardrails.
Detecting Performance Regressions with Real-Time Evaluations
Traditional error rates are no longer the only indicator of success. An agent might complete its workflow without a single 500 error, yet still provide an inaccurate or ungrounded response. To catch these regressions, teams can use Chronosphere to monitor their evaluation scores, such as accuracy or “Rollback Accuracy”, in real time.
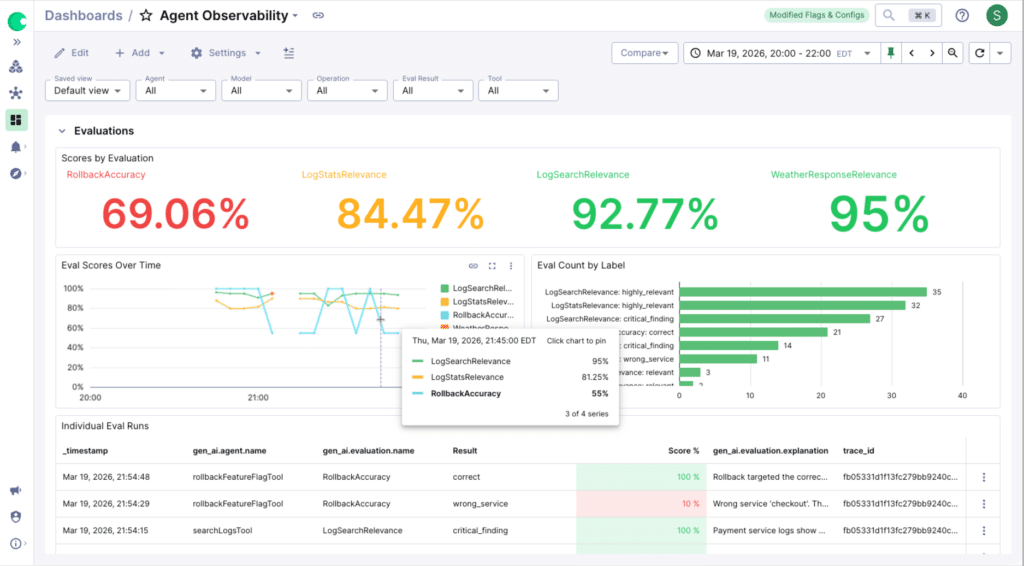
When you send your eval outputs as metrics to Chronosphere, you gain a high-level view of performance trends across your agentic fleet. For example, an SRE might notice a downward trend in “Rollback Accuracy” during a high-traffic event, with recent runs dipping as low as 55%. By visualizing these scores together, you can quickly identify whether a specific model version or agent configuration has begun to degrade.
Decoding Agent Logic Using Traces
When accuracy scores drop or a specific evaluation identifies a failure—such as a 10% score where an agent targeted the wrong service—the root cause is often buried within the agent’s “Chain of Thought.” You can use Trace Explorer to move from a high level evaluation score directly into the full orchestration sequence of that specific run.
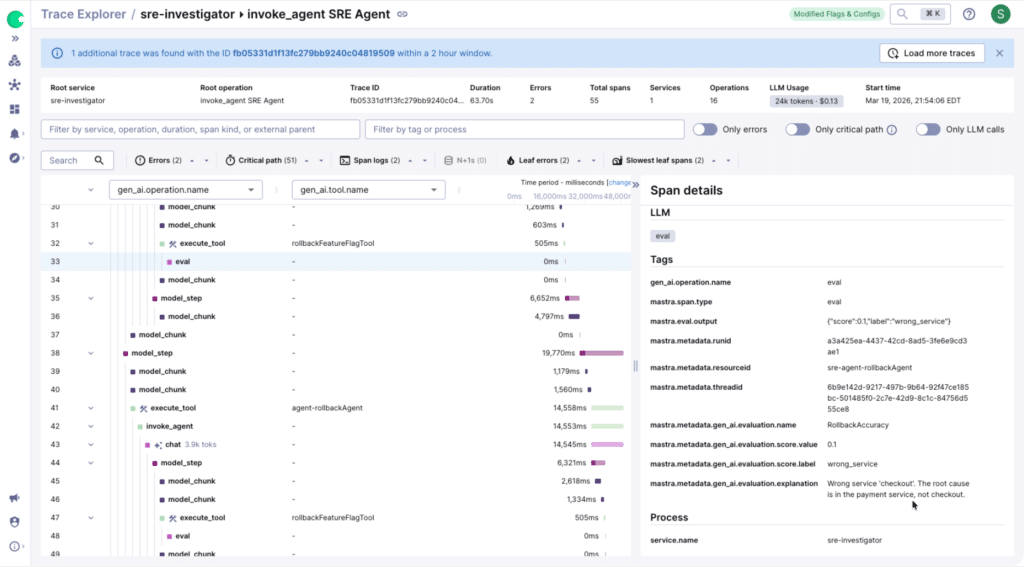
For instance, if an agent makes an incorrect rollback call, the trace waterfall allows you to see the exact sequence of events. In the span details, you can examine the arguments passed to the tool and see where the logic deviated. This level of detail is critical for distinguishing between a transient infrastructure failure and a fundamental logic error in the agent’s prompt.
Distinguishing Necessary Retries from Expensive Reasoning Loops
In autonomous workflows, a high token count isn’t always a sign of failure—it could be the result of a successful self-correction. Conversely, an agent might get stuck in a “reasoning loop,” repeatedly calling the same failing tool.
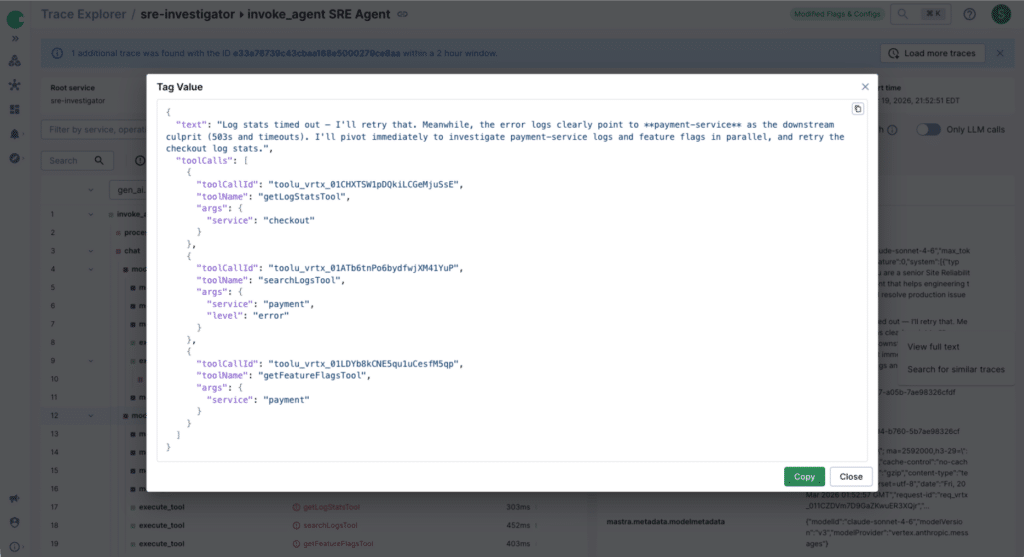
Chronosphere helps you distinguish between these scenarios by correlating real-time evaluations with detailed traces. If, as shown in the example above, a getLogsStatsTool errors out due to a backend timeout, you can use Trace Explorer to see how the agent responded. You can see the agent recognize the timeout and pivot its investigation—perhaps calling downstream logs or feature flag services in parallel.
By identifying these loops and errors in real time, teams can focus their engineering efforts on making specific tool calls more reliable or refining agent prompts to prevent redundant logic. This closed-loop visibility ensures that while agents are given the autonomy to solve problems, they remain within the bounds of operational efficiency your users are expecting.
Delivering Production-Grade AI
The transition from experimental AI to production-ready agents requires a fundamental change in how teams think about observability. Success is no longer defined only by uptime or latency, but by the efficiency of the reasoning process,the accuracy of autonomous decisions, and ultimately the quality of the output. By using OpenTelemetry as the foundation for LLM observability and tying cost metrics to reasoning traces, DevOps and SRE teams can finally gain visibility to the black box of agentic workflows.
Schedule a demo to learn more.

 Blog
Blog