")

Whether you are an online retailer, a physical goods manufacturer, a restaurant chain, or any kind of larger business, complex IT systems are at the core of everything these days. Organizations increasingly depend on them for their ability to operate on a day to day basis, whether they run their IT on-premises or in the cloud.
Unfortunately, IT systems of even moderate complexity are prone to various outages and failures. In the best case, a failure will cause a minor inconvenience, while in the worst case it may cause a costly and prolonged business disruption or even put your entire company in jeopardy.
While it’s unrealistic to prevent all failures occurring in your IT infrastructure, you can work to detect as many problems as possible before they become a larger issue: This is the goal of systems monitoring or observability. Paired with redundant and fault-tolerant system design, you can use systems monitoring to find and fix issues before the users of the system even notice a degradation.
In this article, we look at the most popular ways to gain insight into your IT systems, especially when it comes to detecting bad system behavior and taking corrective action. We will cover the pros and cons of each approach, and then finally highlight Prometheus as one of the most popular monitoring systems for the purpose of making sure that your business continues to run smoothly.
What do we expect from our IT systems?
Before you start to measure system behaviors, it is a good exercise to ask yourself which behaviors you actually care about in a system, and which deviations from the desired behaviors mean trouble. While the details depend on the system in question, users of a system will generally care about aspects such as:
- Availability: Is the system reachable and available to serve users when they need it? If not, users may have to wait, or important business processes may stall and fail to generate revenue.
- Performance: How is the system performing in terms of latency, throughput, or other useful work completed in a given time period? For example, is a website served quickly, or does it take an unacceptably long time to load?
- Correctness: Is the system storing, processing, and returning data correctly? If a system produces incorrect results, users will lose trust in the system, and especially permanent data corruption may cause lasting problems for your business.
- Efficiency: How well is a system using its resources internally? For example, a service using more CPU and memory than needed due to an inefficient implementation will cost you more to operate than a more optimized implementation.
Ensuring these properties helps you maintain a fast and reliable service to your users while making the best use of your resources.
System failures and the need for monitoring
The reality is that modern IT systems are becoming increasingly complex. Especially with the proliferation of cloud services, cluster managers like Kubernetes, and microservice architectures, you often end up with distributed systems consisting of a plethora of layered hardware and software components that all need to function and work together correctly in order for your business to operate.
Given the scale and complexity of modern infrastructures, it is actually rare for most large IT systems to run without any problems whatsoever – most of them are in a constant state of partial degradation and brokenness, even if this is not always immediately noticeable to users.
Here are a couple of examples to illustrate the variety of things that can go wrong in systems and services:
- Disks filling up: If a disk or filesystem runs full, your database may not be able to store any new records, often resulting in user-visible request errors, data corruption, or other unpredictable system failures.
- Software bugs: A software bug may cause a service to crash, impacting service availability or causing data corruption issues.
- High temperatures: If the temperature of a device like a CPU or disk becomes too high (usually due to an insufficient or failed cooling mechanism), the device may break and the services relying on it will fail.
- Network outages: When network equipment fails or is misconfigured, your services can’t communicate properly with each other. The result may again be decreased availability of your services or data not being persisted correctly across a distributed storage system.
- Low memory utilization: A process or container may be reserving way more memory than it actually requires (thus preventing other processes from making use of it). While this isn’t immediately user-visible, inefficient resource usage will cost you more resources and money than necessary to run your system.
There are many more things that can go wrong, but the above are a few examples to give you an idea of the kinds of issues you may encounter. If you want your business to run smoothly, you will want to closely monitor the behavior of your systems to detect these problems as quickly as possible so you can take corrective action before their impact becomes visible to users.
With that in mind, what are some good system properties to monitor that help us detect these problems? While the exact properties will depend on the system you are monitoring, there are a few common characteristics that matter across a wide range of systems. They include:
- Request or event rates: For services that process user requests or a stream of work items, you will want to track the rate of processed requests over time. This gives you an idea of what your system is doing, and whether it is still processing requests at the rates you expect.
- Latency: Measuring how fast individual requests are being processed (for example, as a histogram or percentile) helps you track down parts of your system that are working slower than expected.
- Errors: When errors occur, you will want to either track their rate over time (to make sure that they don’t exceed a defined threshold) or track whether any component is currently in an ongoing state of error that needs to be addressed.
- Resource usage: Tracking the usage of resources such as CPUs, memory, disks, queues, and network devices, can help you gain insight into both the efficiency of your services, as well as aid in predicting capacity bottlenecks and planning for them.
Whether it’s temperature, humidity, voltage, the current system time, or other metrics, there are many more aspects that you may want to measure to ensure that your system is behaving correctly. Let’s see which approaches exist to allow us to measure these system properties and react to them.
Discover how to optimize your system reliability with top telemetry tools in our comprehensive eBook on cloud-native observability
Approaches to getting insight into your systems
There are a variety of ways to measure your systems’ behaviors and get insight into them. Each of them comes with different tradeoffs and applicability for different use cases. Thus in many cases, an organization will not only settle on using a single approach, but use multiple in parallel. Let’s have a look at three of the most popular signal types that you can record, and how they work: event logging, tracing, and metrics.
Event logging
In event logging, a process emits a timestamped record of every individual request or event happening inside the process. The record will often include structured fields covering a wide range of details related to the event. For example, a logged HTTP request may include the client ID, the HTTP method, path, and response status code, as fields:
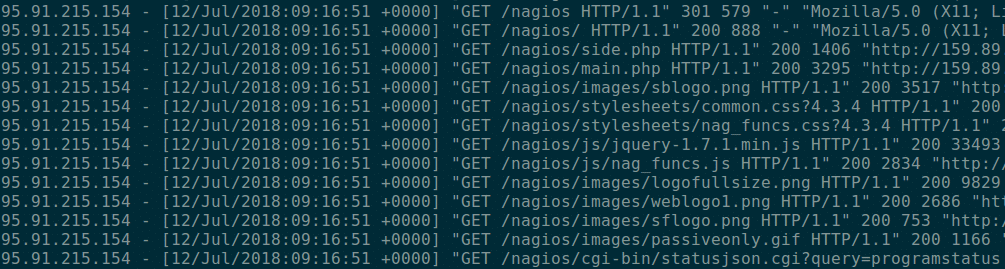
Event logging gives you very detailed insight into your request-serving systems, allowing you to inspect fine-grained details of each individual processed event. However, logging also comes with significant drawbacks:
- Excessive cost: Emitting, storing, and processing every individual request can become very expensive. Especially if you are operating a high-traffic service, this can quickly become a challenge comparable to operating your main infrastructure. Thus in practice, organizations often limit high-traffic event logs in terms of their scope or retention time.
- Limited applicability: Event logging makes most sense for measuring “things that happened,” such as handled HTTP requests or similar events, but it is less ideal for measuring ongoing system states like memory usage and CPU usage.
Due to these limitations, event logs usually only give us partial visibility into a system, and querying large log volumes to determine the overall health of a system can become prohibitively expensive.
Traditional logging is also limited in its ability to help you find and correlate multiple related events, such as a database query that is executed as part of an overall user request to your frontend service. This is where traces come in.
Traces
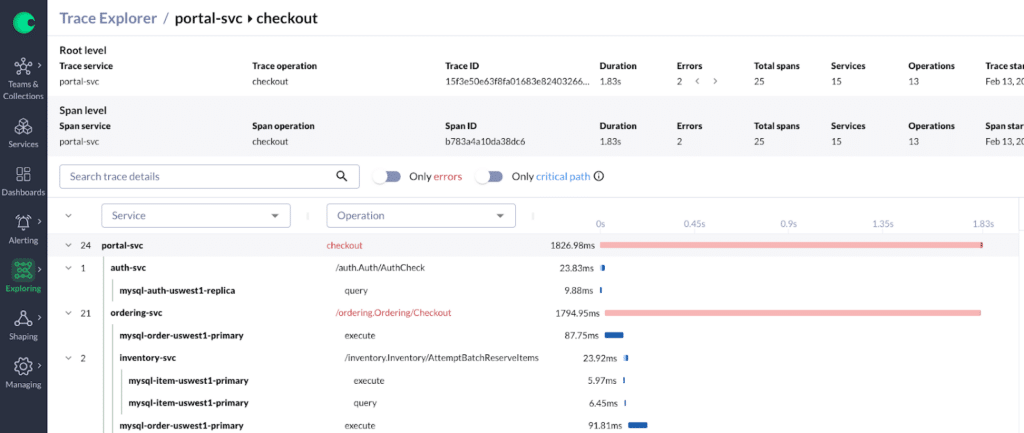
Traces help you understand the full path of a user request through a set of layered systems. For example, understanding the path of a request all the way from a load balancer through the frontend service, and then to the backend database.
When a request hits the first component of a system (in the previous example, the load balancer), it is assigned a unique trace ID (UID) that is propagated from one component to the next along the entire path that the request takes. Each component then records so-called spans that track a given amount of work performed as part of the overall request handling. Each span has a start and end time and includes the request’s trace ID. Traces also record hierarchical relationships between spans when the work related to one span is executed in the context of a higher-level parent span.
The resulting traces are then sent to a centralized system that stores and makes them available for querying. Since spans related to a single request share the same trace ID, they can be efficiently looked up and presented together in a correlated way that can help you debug in detail what happened to an individual request.
While tracing is the method of choice for understanding and debugging the path of individual user requests through a system, it also comes with a set of drawbacks that are similar to those of the logging approach:
- High cost: Similar to logging, recording traces for every user request can become prohibitively expensive. Thus in practice, most organizations will turn on statistical sampling for their tracing system and only track and store every 1000th request.
- Limited applicability: The use case for tracing is limited to tracking requests through a layered system, so it will not help you track request-independent properties such as resource usages or other general health indicators of a system.
As a result, traces are usually not the primary way of monitoring the health of a system, but are often used in addition to other methods to understand and debug the flow of individual user requests.
Metrics
Metrics (or time series) are numeric values that are sampled and stored at regular intervals over time. For example, you may want to record various Kubernetes container metrics:
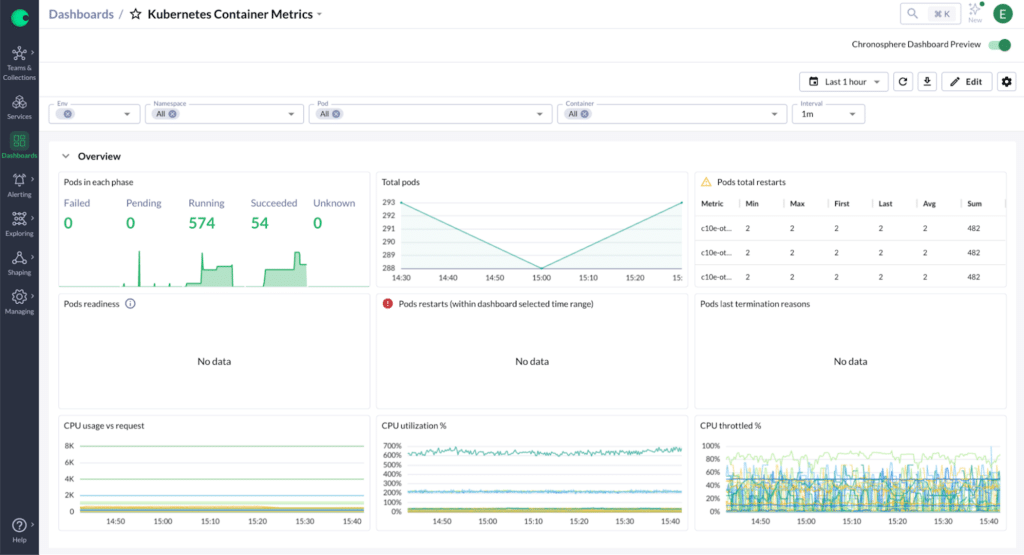
In contrast to logs and traces, metrics don’t allow you to track details for individual events, but they still allow you to record an aggregate value of things that happened, like the total number of HTTP requests handled by a given server process, optionally split into multiple time series along dimensions such as the HTTP path, method, or status code.
While metrics don’t allow you to gain as much per-request insight, they come with some benefits as compared to logs and traces:
- Metrics are much cheaper: Since metrics represent aggregate numbers, they can be orders of magnitude cheaper to track, store, and query. Take for example a service handling 1,000 requests per second: a logging solution would have to store 1,000 individual log records every second, making the logging costs high and proportional to the incoming traffic. At the same time, a metric is just a number that can be cheaply incremented in memory 1,000 times per second and then sampled at regular intervals that are independent of the incoming traffic.
- Larger scope of applicability: Metrics have the widest scope of applicability for measuring different properties of a system. You can use metrics to track aggregate event counts and rates, but also to record event-unrelated data such as resource usage, environmental parameters, and more.
As a result, most organizations base their main systems monitoring strategy on a metrics-based system, while still capturing logs and traces for specific business areas and use cases.
Metrics-based monitoring with Prometheus
When it comes to metrics, the Prometheus monitoring system has evolved to become the de facto standard open source tool of choice across the IT industry. The Prometheus project provides a set of libraries and server components for tracking and exposing metrics data from systems and services, for collecting and storing those metrics, and for making them accessible and useful for a variety of use cases.
Here are some of the main features that make Prometheus so popular:
- Its dimensional data model, with time series being identified by a metric name and a set of key-value pairs called labels. This allows you to track time series data in a detailed and dynamic way from many services at once.
- Its powerful and flexible PromQL query language that allows you to build dashboards, debug your systems, configure precise alerting rules, build automation based on your metrics data, and more.
- Its built-in integration with service discovery mechanisms in your infrastructure (such as a Kubernetes API Server). This allows Prometheus to maintain an up-to-date view of all systems and service endpoints it should monitor, and it uses this data to actively collect metrics from these endpoints.
- Prometheus’ efficient implementation allows it to collect and process many millions of time series on a single server.
- The ubiquity of integrations with Prometheus makes it easy to integrate with and monitor many existing software and hardware components without having to write custom code.
Conclusion
With the omnipresence of complex IT systems and their proneness to failure, you need to be able to get insight into the state of your systems and react to faults before they can disrupt your business. In this article we examined three popular approaches for helping us make sense of our systems and services: logs, traces, and metrics, and how they can track system health.
While each of these signal types comes with different tradeoffs and suitable use cases, metrics usually form the backbone of an organization’s monitoring strategy. This is due to their relatively cheap cost and their broad applicability to recording a multitude of different system health indicators.
When it comes to metrics-based monitoring, many organizations across the industry have adopted Prometheus as their primary system for mission-critical monitoring and alerting, and a large community of developers and users are contributing integrations.
This widespread adoption has made monitoring much easier for organizations to integrate into their technology stack and ensure overall system health – and get the reliability, availability, and stability they desire out of their systems.
For more information on Prometheus, check out the following articles from Julius:


