


To create a compelling digital experience for customers, cloud-native enterprises need to synchronize many architectural elements. Here’s how cloud observability and Chronosphere can.
CloudOps engineers and site reliability engineers (SREs) use the emerging discipline of cloud observability to optimize the performance of their applications and infrastructure. They identify what is happening, triage issues that arise, then assess root cause and remediate the issues. The first blog in our series describes how cloud observability illuminates the intricate workings of cloud workflows, and the second blog explores use cases. This blog, the third and final in our series, maps out the architectures that cloud-native enterprises need to observe.
Elements of Cloud Observability
To start, let’s examine each element that cloud observability helps monitor and optimize. These elements include compute, storage, and network infrastructure resources, as well as containers, applications, microservices, and users. Along the way we highlight examples of risks that raise the need for observability.
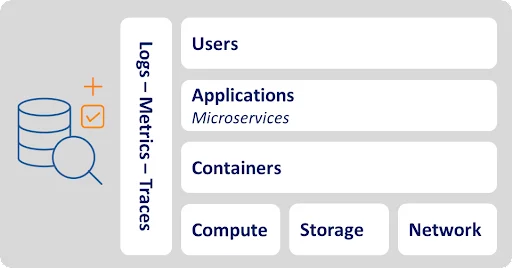
Infrastructure resources
- Compute. Virtualized clusters of compute nodes perform calculations to support application tasks. Amazon EC2, Azure Virtual Machines, and Google Compute Engines all offer elastic CPU and memory for applications to consume as they do this. Overutilized compute clusters can slow or fail.
- Storage. Object stores such as Amazon S3, Azure Blob Storage, and Google Cloud Storage provide elastic storage capacity for high volumes of multi-structured data. They classify various datasets as flexible objects, accommodating any format rather than enforcing rigid tabular structures. Enterprises also can speed performance by using cloud block storage offerings such as Amazon Elastic Block Store (EBS), Azure Disk Storage, and Google Cloud Persistent Disk.
- Network. A variety of network resources connect resources and help them communicate. Amazon VPC and other virtual private networks logically isolate network resources such as routing tables and IP addresses for better security and control. As with compute clusters, overutilized network resources—i.e., when flooded by traffic—can slow or fail.
- Containers. Containers such as Docker bundle applications with system tools, libraries, and configuration files to create a modular package that runs the same anywhere. Tools such as Kubernetes help orchestrate containerized applications. It’s easy to misconfigure containers, which raises the risk of failure. Many enterprises take advantage of managed container services from the public cloud providers such as Amazon Elastic Container Service (ECS), Amazon Elastic Kubernetes Service (EKS), Google Kubernetes Engine (GKE), and Azure Kubernetes Service (AKS).
- Applications. Custom enterprise applications, and commercial software as a service (SaaS) applications such as Microsoft Office, Dropbox, and Slack, all run on the cloud. Mobile apps such as Facebook, Instagram, and Uber enable consumers to procure services and interact with each other on cloud platforms.
- Microservices. These modern applications contain microservices that perform atomic tasks such as logging in users or processing transactions. Like Legos, microservices serve as modular, interoperable, and independent pieces of software. Microservices can increase latency because they require multiple handoffs and dependencies.
- Users. Cloud applications support all types of users. Professionals use applications, host files, and communicate with one another. In their free time, people chat, share pictures, and get driving directions from cloud-reliant applications. Bursts of users during peak periods—such as Cyber Monday—can overwhelm applications and the elements supporting them.
Optimizing Cloud Observability
Cloud observability helps optimize the actions and interactions of these elements by analyzing three primary types of data: metrics, traces, and logs.
- Metrics. As the name suggests, metrics provide numerical information about elements and tasks measured over time. They might measure application response times, compute utilization rates, or network throughout.
- Traces. Traces, meanwhile, describe the sequences of tasks that elements perform. For example, a trace might show how a compute cluster, virtual private network, and container interact as they execute an application service request.
- Logs. These elements throw off myriad logs. Each log is a file whose data describes an event such as a user action, service request, application task, web page view, or compute error typically in an unstructured form. Logs also describe messages that applications and other cloud components send to one another.
Enhancing Cloud Observability Performance
Cloud observability solutions such as Chronosphere help identify, triage, and assess the root cause of issues to optimize the software lifecycle and infrastructure performance. Armed with this intelligence, enterprises can then remediate the issue. Let’s examine how these observability phases apply to the elements and data types described above.
Identify
CloudOps engineers and SREs define the thresholds for actionable information, then configure notifications based on these thresholds. For example, they configure alerts to fire when compute cluster utilization metrics exceed their specified percentage, containers emit certain error logs, or application response metrics exceed a specified amount of time. They activate these alert settings, ready to respond when an alert hits their Slack or PagerDuty application. They refine their settings over time to ensure they send the right alerts to the right people, filter out the noise, and enable prompt response. When an issue arises, they might be able to resolve it by rolling back a recent production code release.
Triage
Next, CloudOps engineers, SREs, and developers triage the issue that arose. They scope its business and technical impact, for example by reviewing metrics, traces, and logs to determine (1) which element had the issue and (2) which elements that issue affected. For example, a failed network connection can lead to a slowdown in the compute cluster, the application, and microservices, leading to a spike in user waiting times. The team inspects these data points by reviewing a central dashboard and querying the dataset.
Assess root cause
Now the fun starts. The team parses the many metrics, traces, and logs to understand the upstream and downstream dependencies of all the affected elements. They might switch between multiple tools as they inspect these data points. Once they isolate the issue—perhaps a faulty load balancer, overloaded compute cluster, or erroneous messages between various elements—they are ready for remediation.
Remediate
The team fixes issues in a variety of ways. The CloudOps engineer or SRE might have their cloud provider change out the load balancer or configure new utilization thresholds on the computer cluster. They might remediate the erroneous messages by turning them off, asking the cloud provider to do so, or having a developer debug the microservices involved. They put their fix to production and reconfigure alerts as needed to identify similar issues in the future.
Conclusion
If implemented well, cloud observability can help cloud-native enterprises keep all their moving parts in sync—provided they address the full range of architectural elements described here. This concludes our three-part blog series about cloud observability. You can read our previous blog posts about cloud observability here.
Explore use cases on implementing cloud observability for enterprise companies here.


