
Alerts are on the rise
Alerts are on the rise, and engineers are experiencing burnout and alert fatigue. When an alert comes in, engineers need to quickly know two things:
- How urgent is it?
- How important is it?
Unfortunately, these two basic questions are not always easy to answer. That’s why we are excited to announce Alert History for Monitors (Chronosphere’s alerting engine) to give engineers the context they need to more efficiently and quickly answer these questions. This post provides details around the ways Alert History accelerates the triage process, and makes the on-call and post-mortem processes less painful for engineers.
Every engineer who is debugging an issue – especially during an on-call incident – wants to know as much as possible about the alert in as little time as possible. If you are already deeply familiar with the metric that triggered the alert, you likely already have the context needed to quickly assess and triage in your head. But what if it’s not?
If you are not familiar with the metric, you need to get the necessary information as quickly as possible to decide whether the notification that just woke you up at 3:00 AM needs immediate attention or not. And even once you’ve successfully resolved the alert, without the historical context of the alert in one place, you have to piece together data from old emails, Slack messages, and PagerDuty logs in order to post mortem the incident.
With all of this context, you don’t need to guess at the alert’s importance and urgency. You can more confidently decide if you need to get others out of bed for an all-hands-on-deck incident response or to leave it until the morning.
Take the guesswork out of understanding an alert’s importance and urgency with Alert History
Alert History is a powerful new addition to Monitors (Chronosphere’s alerting engine) that opens a new window into your data by looking back at an alert’s activity over time. For engineers currently relying on open source alerting solutions that lack historical context for alerts, such as Prometheus Alertmanager, Alert History adds value by:
- Focusing on the most relevant alert activities: Alert History allows engineers to filter by alert activity. Focusing on the most relevant aspects of an alert reduces the noise around managing lots of alerts, allowing engineers to quickly understand whether an alert is important and/or urgent.
- Quickly understanding an alert’s pattern: Alert History allows engineers to see and understand the expected behavior or trend of an alert.
- Making on-call duty less painful: Alert History gives on-call engineers the information they need to quickly and efficiently assess, triage, and post-mortem an alert.
How does Alert History work?
Alert History can be found in the Monitors page so customers can examine an alert’s context alongside other information related to the alert.
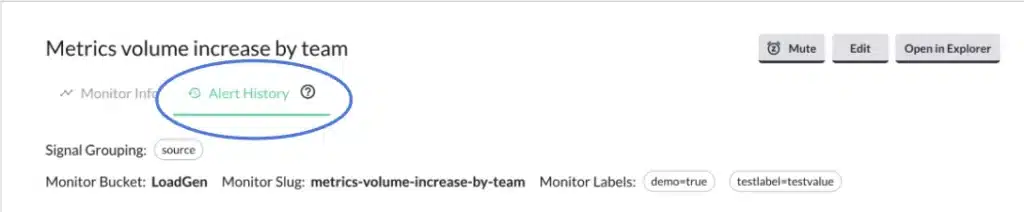
An alert is made up of different types of events. We allow you to view all of them together or to filter the Alert History information down to a specific event type.
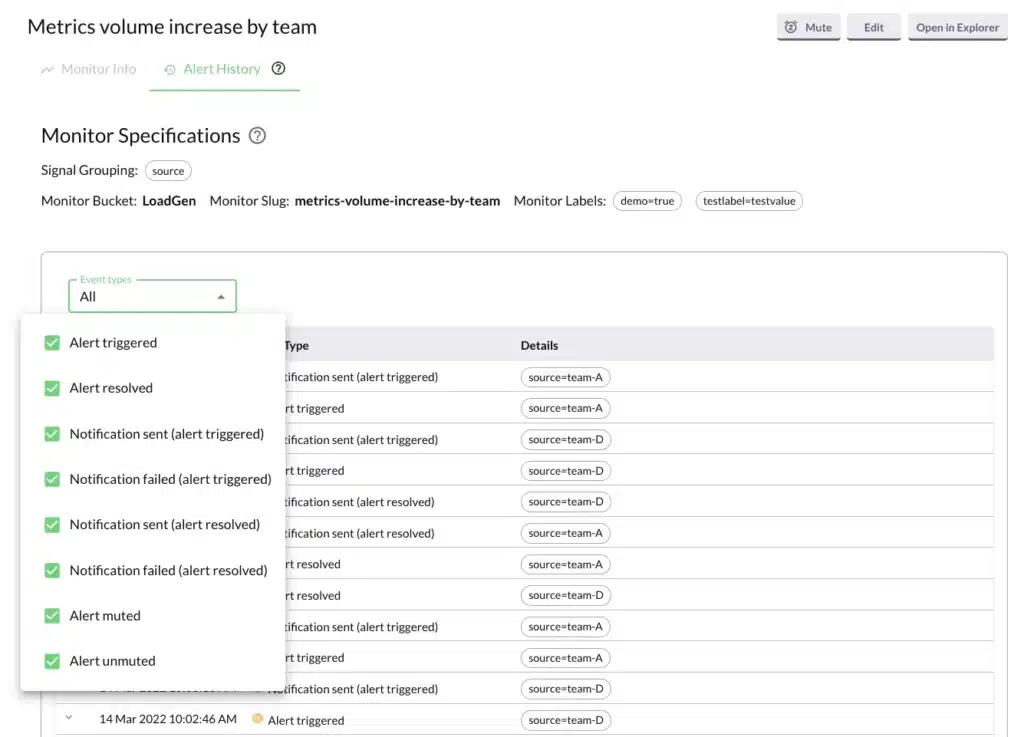
To further refine your view, you can filter an alert down to a specific signal grouping and Alert History will filter down the alerting activity to match the selected signal.
How can you use Alert History?
Here are three practical examples of when knowing the history of an alert’s activity can help when trying to understand and triage an issue:
- You are on-call and receive an alert notification. It’s a critical alert, so it immediately gets your attention. The notification contains little context, so looking at the alert on the Monitors page helps you understand why it fired. But you’re still unclear how urgent it is. Using Alert History, you see that for the last few months, the alert fires every Tuesday at 10:00 AM and then resolves 15 minutes later. You check with a colleague and learn that a batch job runs every week at that time, and the resulting increase in traffic sets off the alert. You stop worrying and get back to your work.
- An alert fires at 2:00 AM and gets you out of bed. It is a critical alert and one you haven’t seen before. Your initial investigation helps you understand the alert’s behavior, but not why you just received this alert. Nothing significant seems to have changed. You look into the alert’s history and quickly see that the muting rule for suppressing notifications just expired. This is why alerts notifications are now being sent. You don’t know why the alert notifications had been muted, but you know why you got the notification so you’re no longer worried and can look into this more in the morning.
- An alert is firing on a pretty regular basis. It’s too important to mute, so your team just tolerates the noise. But you’re trying to reduce overall noise, so you start digging through the history of the alert. There is no obvious pattern as to when it fires, but you know that it fires a lot and then resolves. You do some additional research and learn that the time series value barely touches the threshold value for less than a minute before going back down below the threshold. So you decide to increase the duration of the threshold’s sustain period for the alert, knowing that if an issue occurs the new, longer sustain period will be met and alerts will still be sent. The noisy alert quiets down, and you are a hero on your team.
What’s next for Alert History?
Regardless of experience with an alert, engineers can now assess and triage an alert quickly and confidently with Alert History. Alert History’s core functionality is now available for all customers. Over the next several months we’ll be adding several enhancements to this functionality, including a graph view of Alert History for customers to visually identify and understand any patterns in an alert’s activity.
If interested in learning more about Chronosphere and Alert History, request a demo or get in touch.


