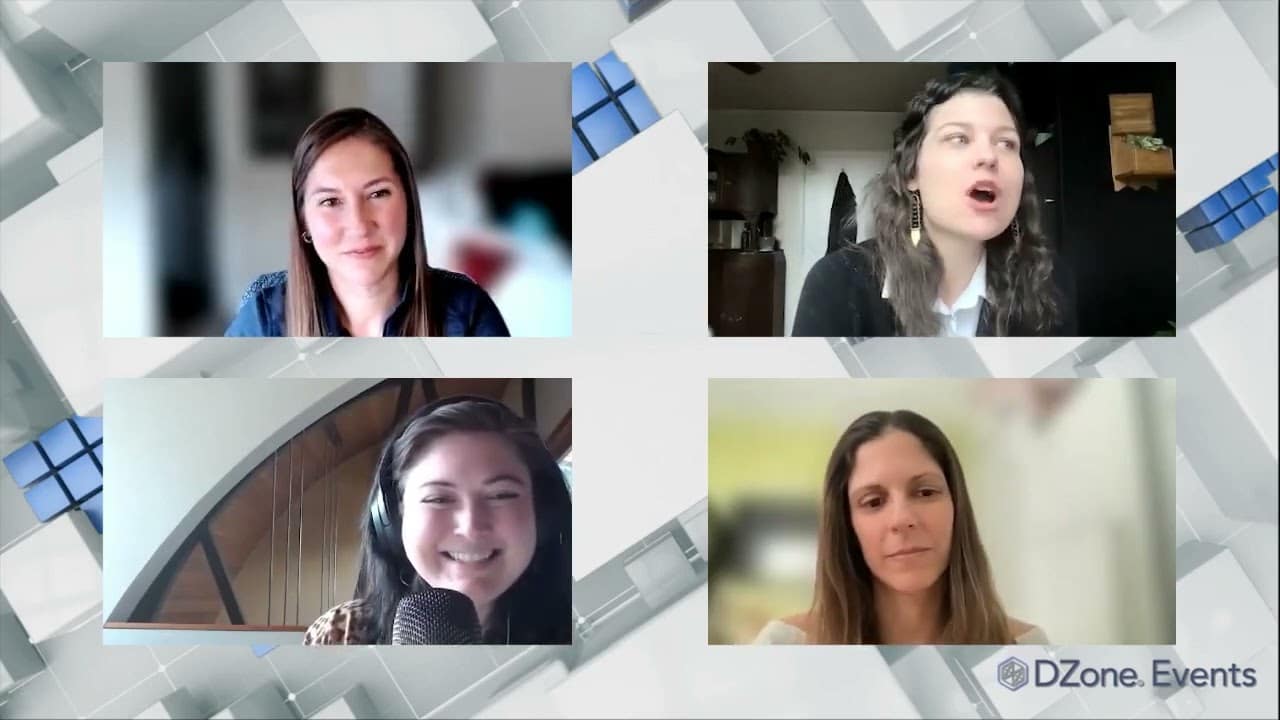
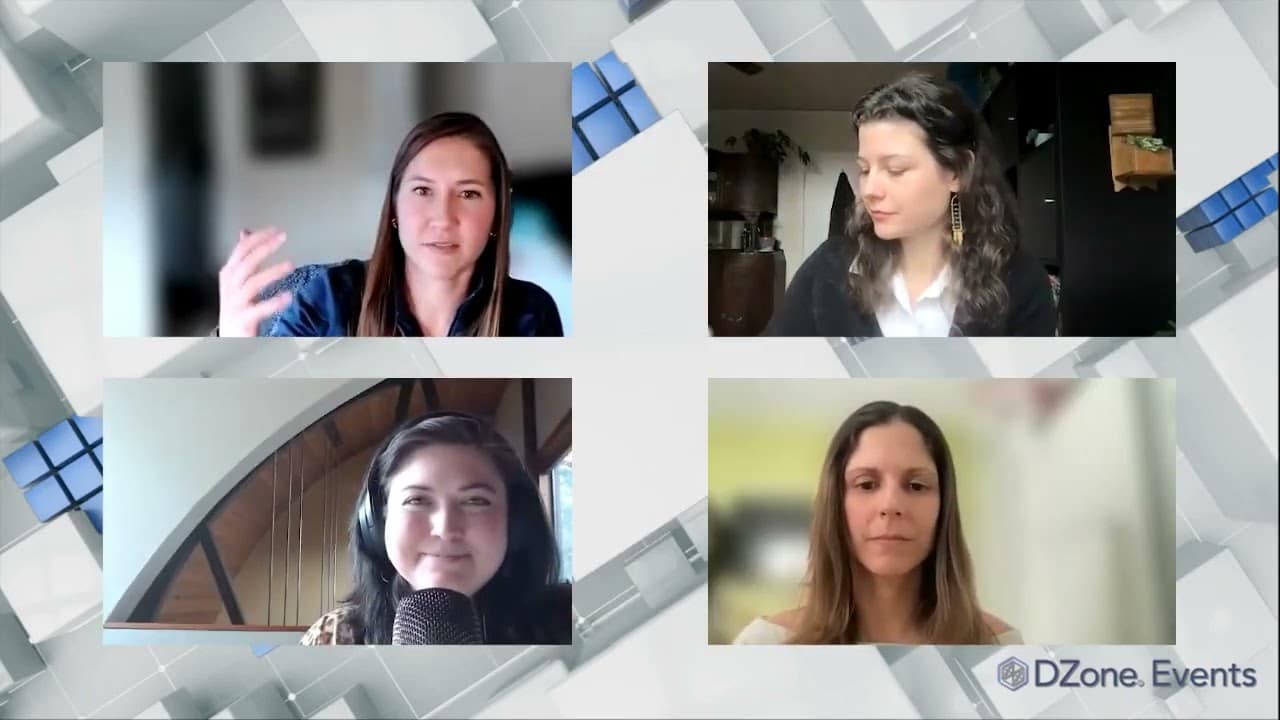
In honor of 2023’s International Women’s Day, Chronosphere hosted a webinar in partnership with DZone – Women In Observability: Then, Now, and Beyond. In the webinar, Chronosphere’s very own Paige Cruz chats with a group of women in tech about their observability journeys.
Participating in the webinar as expert panelists are principal software engineer at New Relic, Amy Boyle, senior developer advocate at LightStep, Adriana Villela, and Chronosphere’s product manager, Julia Blase. As they adventure through their individual experiences in observability, Paige presents around-the-horn style Q&A for the group that offer unique perspectives on what observability looks like to them – past, present and future. Topics explored in the discussion included:
- Past observability tools of choice
- How panelists ventured into the observability space
- Biggest observability challenges for organizations
- What organizations should keep in mind when it comes to open source
- How observability data is put to work
- What the future holds for observability
If you don’t have time to watch the full half hour webinar, check out a full recap of the chat below.
Observability tools of choice
Paige: We want to reflect on your journey with observability throughout your career. And first, I would love to know what signals (whether it be metrics, logs, traces) or tools did you rely on at the beginning of your career, and is there any feature or particular visualization that you missed from today’s tools? We’ll get started with Julia.
Julia: Thank you so much Paige, and nice to meet everyone here. It’s so funny – thinking back to the very beginning of my career, I was an art historian, so there was kind of a winding journey through finance, museums and research data back into the tech world. But when I first joined a tech company, I was really in a customer facing role, and I was often working on high security systems that were in air gap classified spaces. So, the first time I really started to use observability, I would be on the phone with someone and I would say: “Hey, this customer is reporting a problem.” And they would say: “Okay, what I need you to do, because I don’t have a clearance, I can’t come on site, I can’t access the system, but I’m the engineer who built it. So, what I need you to do is SSH (secure shell) to this box and grep through a bunch of information to find this word, and then tell me what you see around that word. Repeat that back to me, and we’re gonna try to debug this from a distance together.”
So, I really started out with logs and this kind of strange introduction to the observability world. It was just a really odd introduction. Over time, I think I grew to use a lot of Prometheus Grafana, and that was something that could deploy into that sort of high security environment and use. And I learned to read metrics output, I learned what a CPU (central processing unit) was over time and then eventually made my way back into the product and then directly into the observability space. But, maybe a non-traditional introduction to observability.
Paige: Amy, would you like to share your first signal that you used back in the day?
Amy: So, I started off doing software development for neuroscience research. I worked in a couple different labs, and that was basically working on desktop apps. And so, there’s two things I really used. One was logs; I actually didn’t really even know about the concept of metrics or traces or anything like that. All I had was the log files or just sitting down physically with someone and watching them walk me through a bug or what was slow on my application and just physically observing.
Going and working at a monitoring tech company was a pretty big jump, and it blew my mind how much there was out there when I started to learn about metrics, events, and auto instrumentation that reports up to the cloud. And, that was pretty exciting for me when I started exploring that world. And that’s grown a ton as well, even since the several years that I’ve been doing it.
Paige: Our space changes so rapidly. Adriana, wrap us up with your first tool or signal that you leaned on.
Adriana: I guess [it would be] console print statements and logs, from the early days. QBasic was my first programming language. So, I definitely relied heavily on console outputs. And then I spent 16 years as a Java developer; logs were like my life when debugging. I also did a bunch of database developments – so, leveraging those select statements. I got really good at complex Oracle SQL queries to help debug. I journeyed into the observability world when I took on my position prior to where I’m at now. I managed a couple of teams at Tucows – a platform team and an observability practices team. And I had some inkling of observability when I joined, but I found myself in a position where I had to level up pretty fast.
I did a bunch of reading and I blogged about my experience. So, I would say my next signal after logging was really traces. That’s where I fell in love with traces and I’m like: “Oh my god, this tells you the end to end story of your system. So, for me, that blew my mind. It was cool that I ended up working for an observability vendor as the next step of my career. So, that’s how I wound up here.
Journeying into the observability space
Paige: I love it. And we have such a good cross section of observability companies represented today that we all work at which is one of the really exciting things about this panel to get to talk across companies. So, we’ve covered this a little bit, but were there any particular early projects or events that got you interested in observability, or what led you to apply to the companies that you work for today?
Adriana: Because I was blogging about my observability experience, I got a message from my now boss, after I posted a blog post on Twitter and he was like: “Hey, how would you like to do this for a living?” And I was like: “This sounds like the best thing ever.” So, that’s how I ended up at LightStep. And LightStep was one of the companies that I’d been following. So, I was pretty excited to be working with some people that I knew about and admired from afar.
Paige: And Amy, what brought you to New Relic, outside of the neuro world?
Amy: I would dabble in creating my own little web applications and things like that. And I was aware of New Relic because they have a Portland office, and I’d been going to occasional meetups, or they would often host meetups and things like that. So, I’d heard about them. And so, I had someone kind of point them out to me and I decided to try it out. I’m like: “This sounds interesting, see what it’s about.” I had a little Flask app of mine that I had just built, and I think it was like a little recommendation engine that I just built as a little toy. And, I had installed the New Relic agent, logged in and I was just amazed. I’m like: “This is magic,” how it’s monitoring my app in real time and all I did was pip install. It blew my mind a little bit. I thought: “This is really interesting and I want to know how it was done.” And yeah, I ended up applying for and getting a position on the Python agent – getting to dive deep into how we are hooking in and getting those metrics.
Paige: And you followed that curiosity past the Python agent team, and now I believe you work on, I want to say, Kafka ingest.
Amy: I work on the backend streaming data pipelines, so it’s kind of right in the middle. It’s usually streaming query, metric aggregation, that sort of thing. You do use a lot of Kafka.
Paige: Where all of the action is. And Julia, you had a long and winding path! What got Chronosphere on your radar?
Julia: Yeah, some early projects that I think got me really interested in observability and put me on the path were really starting to work on the product side of things. So, I started in that customer facing role, moved to the product side of the organization, which is really where I first learned that metrics and logs didn’t observe from nothing – you instrumented them. I was so intrigued, and I have to say, I worked with some great developers who really walked me through how this works and what you can learn from observability in depth. I had the opportunity to then go work on the central observability team for my previous company as a product and project manager for them. And, I think I just kind of fell down this well of interest in learning how software worked. I think that was kind of a theme in my life.
The (happy) observability rabbit hole
Julia: I always wanted to know, not just that the car ran because there was an engine in it, but how fuel injection engines work, and what does a piston do, and why do we have these different grades of gasoline? And, I always kind of want to go to the root of a system and know why it’s functioning. And, I think working on that observability team, I really saw that that’s the insight you got into software from being deep into the observability world and seeing how it’s produced and collected, and then presented back to engineers for them to make use of it.
So, when the opportunity came through a friend, who had actually been working at Chronosphere, to work for a company where that was all they did full-time every day, I was so excited and I was like: “Well, this is heaven. I get to spend all of my time in this world, understanding and translating it for other people.”
Paige: The rabbit hole goes deep. And, it’s a happy rabbit hole that I am in. I am on my third observability company, and it’s just very meta to explain to people: “Oh, I work on software that monitors other software.” It gets kind of fun explaining it to folks outside of the industry.
Observability obstacles for organizations today
Paige: Let’s switch gears to the present day. There are many misconceptions about both monitoring and observability – from simply how to define them or whether push versus pull based systems are better. Let’s talk about observability practices or paradigms that are holding organizations back today. What have you seen or heard anecdotally or read on a Reddit thread? Let’s start with Adriana.
Adriana: So, I can speak from firsthand experience at an organization that I worked at, where I’d say one of the biggest challenges was getting teams to instrument their own code. I think companies end up in this chicken and egg situation, whereby things are on fire. And so, they know they need observability. And in order to leverage observability, you have to instrument their code, but they don’t have time to instrument their code because things are on fire. And so then they have this tendency of going: “Oh, let’s go to the SRE team, or let’s go to the observability team, and why don’t you guys instrument code for us?” And, of course, I’d say that is the most terrible practice ever because these people aren’t intimate with your code. They don’t know what needs to be instrumented – so that that holds people back.
The other one that I would say that I’ve seen is this idea that some people come from the old school, monitoring background of “Let’s have a bunch of big monitors on a wall with a bunch of dashboards, and let’s stare at them all day and see if something breaks.” And to me, I feel like that’s an observability anti-pattern. But yet, a lot of organizations that claim to want to practice observability, still find themselves in that situation where they are beholden to the wall of monitors. And again, I feel like that prevents them from really moving past the old way of thinking, and into the new paradigm shift of observability, where it’s about following those breadcrumbs to answer the question: “Why is this happening?” And I don’t feel like monitors or dashboards necessarily give you all of that.
Observability as part of the development process
Amy: I think the kind of general approach – maybe a mindset, and thinking about observability as part of the development process – some of the things that I feel like I’ve run into are kinda being surprised by things after the fact and needing to think about observable code. And when you’re making a change, do you have the signals in place that you’re going to be able to know what happened, and know both the impact from performance perspective, but also maybe from a customer impact sort of perspective. And really thinking about it as part of when you’re writing the software: “Can I build this in?” And that kind of ties in a little bit with what Adriana was saying, which is if you make it part of your development process, it grows more organically than having to come in and just sweep through and try to make your code observable in a sort of disjointed sort of way.
Paige: I’m hearing “instrument as you go.” Lots of good strategies here. And Julia, what have you seen in the field as far as practices or paradigms holding organizations back from unleashing true observability?
More data is not always better data
Julia: Some practices and paradigms I see in the fields that maybe hold people back – the first two things that come to mind are things that I think Adriana and Amy mentioned. The first phrase that popped into my head is more data is better data. And Adriana, I think of your wall of monitors. This is the classic network operations center. I’ll just put more lines on the graph. I’ll have more graphs in front of my team. I’ll put them in a big round room and surround them with monitors. And if we have all the data, we’ll definitely catch and fix the problems. And I just think that’s so not true. It’s the right data at the right time and the right context. And that’s really the key to observability. And the other one of course is observability comes last.
I think that really holds people back: “Right before we roll out, did we instrument that code? Let’s add some things and then we’ll ship it and it’ll be fine.” And I see this even with handoffs. Like in today’s architecture, when we have microservices and they change hands and teams all of the time, the last thing you do in handoff is say: “Hey, what signals are valuable for this particular service? What’s a sign things are going wrong?” I rarely hear that as part of handoff conversations, even in our own company. And I think that’s so important, because if you’ve worked with a service before and you’ve seen it experience severe incidents and issues, you can tell that next team: “Here’s what to look for. Here is the right data in the right context to put in the right monitor so that you catch bad things before it happens.”
So, I think those are the two things that come to mind. I’ll also add a very small thing, but the other thing I hear is that no one will use traces. And I think that’s so sad. Adriana, you mentioned the magic of seeing a distributed trace. I do think that not many people use traces. I think sometimes we just say: “Here’s a bunch of tracing instrumentation – have at it.” No one has time to learn it from the ground up. But if you can say to an engineer: “Remember that incident you had last week? You looked at this and then you did that, and three hours later you found this. I’m looking at your traces for that time, and I see this and that points me to this, and five minutes in I’m at the root cause that it took you this much time to find in other ways.” So, I think if we can do better workflow-based education, many people can use traces in a very powerful part of your observability infrastructure. That is, to me, underutilized today.
Paige: I couldn’t agree more. And, a really interesting disconnect that I hear is, for folks of us that work in observability companies, we have been working on tracing products the last four or five years. And so for us, these conversations and thinking about tracing and workflows is almost common, almost mainstream. And then you talk to folks that are software engineers at non-observability companies, and they are just at the beginning of tracing, they’re skeptical of tracing. And I am with you – that education is the bridge that we need to bridge that gap between the old paradigm of metrics and logs, which are still totally useful. But, to get to this next level and seeing the end-to-end request, I’d love a trace.
What organizations need to keep in mind about open source
Paige: It is a really exciting time for, specifically, open source instrumentation – with the development and adoption of OpenTelemetry, tracing and metrics, Prometheus, EBPF (The Berkeley Packet Filter) and so many more. What, in your opinion, do organizations need to keep in mind when they explore OSS (open source) instrumentation? Let’s start with Julia.
Julia: I think a big thing that organizations need to keep in mind when they transition to OSS instrumentation is that it can initially feel like a downgrade. I think, if you’ve been using proprietary software and systems, you understand how things work, you’re probably very comfortable with them, your devs speak that language. And even though there’s so much power in OSS technologies from being able to be more flexible, more creative, leveraging that open source community, which is very strong these days in the observability world – and also being able to deploy your own releases and manage all of that yourself – there’s so much power. But, you also have to learn all of the languages of the open source technologies. And I think, initially, if you do that transition fast, and I think to our point about education earlier, if you don’t go into it, understanding that you’re going to need to educate your teams about how this works, it can initially feel rough and feel like a bit of a downgrade. But I encourage people to work with their teams in advance, educate them, show them the power of this, and just support them through that transition. Because once you’re on that page, the power is just really evident to everyone using it.
Standardizing with open source
Amy: I think it’s really exciting. I think it’s going to allow us to, as an industry, try to help standardize on things. And I actually think that when it comes to what’s holding companies back, I think it depends on whether they’re a small or large company. For smaller companies, just getting some metrics in can be really important when you don’t have anything. But, with some of the larger ones or the more mature [companies], discoverability and portability tend to be a really bigger issue. And I think that the OSS tooling can help us both within companies and as an industry to try to be like: “We’ll start getting a little bit more standard on the way that we have our data models or maybe even some of our naming.”
Even as a vendor, it can help us make some of those data model decisions for us, which sometimes can be challenging, but I think it also will kind of allow us to focus on what the real value adds for us and our products are – and not just that we’ve got you locked in because you’ve embedded our code into your code and you’ve got a vendor lock in. So, I think it helps drive better products actually as well.
Paige: Absolutely. I’m very excited about the world of “instrument once and never again,” or “decorate later”. You know, instrumentation won’t go away, but I would love for developers to focus on adding the business value span, context, or logs, and all of that jazz.
The power of give and take with OpenTelemetry
Adriana: I’m definitely a big advocate of OpenTelemetry, even before I joined LightStep. I would say that getting into open source tooling can always be scary. And, I’ve experienced it working at large enterprises where they’re like: “Wait, I am not paying a vendor for this? This is kind of weird.” And they’re almost looking for something to throw money at. But, if you write Java, like Maven and Gradle for building your JAR (Java ARchive), they’re open source tools, there’s no one to pay for this. On the same front, using any open source tooling, when you’re deciding to use it, I think you have to understand what you’re getting into, right? Like, when I was at Tucows, I ran the observability practices team there and wanted everyone in the organization to switch from using a vendor provided SDK (software developer kit) for instrumenting their code, to using OpenTelemetry, so that it would give everyone that freedom to switch, if they wanted to switch to another vendor.
But, it also meant knowing what it was that we were getting into. So how widespread is OpenTelemetry, is this thing gonna stick around, right? How many people are using it? And these are all really valid questions. And if you’re a large organization or maybe even a small organization looking into tooling like that, you will want to answer those questions or know the answers to those questions. The other thing I would say is, if you are venturing into the world of using open source tooling, I think it’s important to know how often this thing is maintained, right? Like how often are people contributing to it? But also, if you’re going to be using it, encourage folks in your organization to contribute to it. Like at my previous job, I remember there were a couple of issues with something in the OpenTelemetry collector and my team was like: “Oh, we’re waiting on a fix for blah, blah, blah.” And I’m like: “Well, why don’t we put in a fix for this so that we can move things along?” You know, we’re reaping the benefits, but let’s also contribute to it and make it better.
Paige: I think that is the beautiful part of open source – it should be both a give and a take. I think about how Terraform did a great job opening up their providers, and when I was at LightStep, we worked on the Terraform provider for Codefresh, and being able to write our own tooling to serve our needs and then contribute it back was really rewarding personally and obviously for our company. And it was wonderful to get to share that with everybody. I totally agree with you there.
Using observability data to help make business decisions
Paige: Since we have such a lovely cross section of roles, I’d love to hear how you use observability data in your day-to-day to help make decisions or plan. And Amy, I think you might have the most straightforward use case of all of us, but share when observability data comes up for you and how you put it to work.
Amy: Yeah, so I am an engineer and architect now, so it’s kind of two different flavors of similar things. So, either I’m working on something, either working on a prototype or pairing with a team, and I’m looking at either some existing metrics or I’m adding some, as part of that work. Doing that: “Is this having a performance impact looking at CPU (central processing unit) memory bites in and out type stuff?” As well as any sort of metrics that they’ve added that’ll tell me whether or not the functional impact is happening. I’ll also take a step back sometimes and think about things like: “What is the direction for our software that we need to take? Where are our large data flows coming in? How much are these different paths being used?” So, thinking about the strategic level of design when it comes to software, making sure I use the monitoring to make sure that I can understand our system, how it works, so that I can design the best direction for it to go in as well.
Using observability for the development process
Julia: I think I rely on observability data quite often for that strategic planning and direction that you were talking about, Amy. Looking especially at any user facing parts of our applications, at the APIs that we expose, seeing when traffic is spiking, what traffic is spiking in order to try to correlate that with events that we see coming from our customer systems so that we can understand: “Hey, this is most useful when X is happening. Why is that?” And use that to kick off those conversations about what people are using, where we need to build out more support, what things they wish they had, that they don’t have yet. I think also, though, to come full circle to that development process, I think we actually use tracing on my team quite a lot, to monitor new parts of our platform as we roll it out. Look at that performance, understanding what’s happening throughout that distributed architecture, and root causing issues even in early dev and test environments to make sure that we resolve them before they go out to customers. So, I really enjoy working with my team. They’re great at using traces. I hope people continue to invest in those, especially early in the development process.
Paige: I am with you. Adriana, I think you would agree, more tracing for everybody. And how do you, as a senior developer advocate, put observability data to work?
Adriana: It’s kind of an interesting couple of use cases that I can think of. I guess on the one hand, I put observability data to work when I’m working on, let’s say a demo for something that I like, if we’re partnering with another organization, and we’re trying to POC (proof of consent) something. I found myself, at times, basically working on a POC and trying to debug it, and then I have a little voice in my head going: “Oh, you can’t see it in the observability system. You haven’t instrumented it properly.” And so, I’m trying to make sure that I follow the advice that I give to other people in terms of troubleshooting. But then, there’s also using observability, in a more abstract manner, which is when speaking with different organizations – even within the OpenTelemetry community, for example.
I’m part of the end user working group in OpenTelemetry, and one of the things that we do is bring users of OpenTelemetry together, to talk about how they use it in real life. And sometimes, it involves giving advice on how to best use instrumentation. It’s not so much me using the instrumentation personally in that case, but rather educating other folks on how to instrument their code to get those observability superpowers.
Paige: Yes, that education is so critical, especially for folks who don’t work at observability companies like us, and who don’t have the luxury of thinking about this stuff day in and day out.
Looking at the future of observability
Paige: So, with that, we’ve covered the past, and we’ve covered the present. Let us gaze into the crystal ball of the future, and wrap up with a prediction for the future of observability from either adoption, to career titles (like observability engineer), tooling advancements, or your far-fetched theories. Adriana, would you like to share your prediction for this year, or the next two years of observability?
Adriana: Yeah, definitely. So, two things come to mind. First of all, my prediction is that observability won’t be a separate thing from software delivery. It’s something that should be baked into development, QA (quality assurance) and SRE. So, it should not be off on its own little corner because it’s essential. And on the same thread of observability being essential to QA, one of my predictions is that trace-based testing is going to become a big thing. For those of our listeners who are unfamiliar with trace-based testing, it is basically leveraging existing traces to create test cases. So, the most common use case for QA is to leverage traces to create assertions for their integration tests. And, there are a bunch of really cool tools out there that are worth giving a shout out. There’s Tracetest, Helios, and Malibu. And, I’m hoping that there are others out there that I’m not even aware of. I really want to see a growth in trace based testing, because I really think it’s going to really help give everyone super duper powers in observability.
Demystifying your data
Amy: I think it’s something like making better sense of the data, especially when it comes from disparate sources. That’s something I think I’ve spent a lot of time thinking about lately is like: “How can my observability build my architecture diagrams for me in a way that’s showing both what it looks like and where the problems might be in a cohesive way.” I feel like it’s easy to get those in pockets, but getting that in a way for larger systems as a whole has been challenging. I’m excited that the more that we’re doing with distributed tracing, I feel like we’re getting there, but even before at an observability company, we don’t have a place where we can go and see that.
Paige: And I’ll add to that. I would love to see, not only the realtime architecture diagram, but also the historical evolution: to go back in time and see how an architecture for a particular part of the stack changed. That would be a fascinating journey at New Relic, to watch the Ruby on Rails explode into a constellation of complexity.
Preparing for a crisis with observability
Julia: Can I say two predictions for the future of observability? I think one, tactically I see observability evolving to a place where it really is elastic in terms of the amount and level of information it collects, depending on the context. So, I see observability becoming context aware and saying: “I see a trend line here. I’m going to turn up the log level for you” or “I see that the crisis seems to have passed. I’m going to turn this down, I’m going to collect less because now we’re out of this moment.” I think there’s a lot of manual work still when it comes to making an observability system responsive. I think that’s often why we end up with the more data is better data, because you just don’t know when the crisis is going to come. But I hope our observability systems evolve and say: “Hey, we can actually see when the crisis is coming and we’re going to help manage that for you, and also manage the wind down for you so that you’re never paying for more than you need to have.” So, I think that’s kind of my tactical prediction for all of our systems in the next couple of years.
I think my strategic prediction, if I can put that hat on for a moment, is that we see a clearer path for observability officers, or for observability teams, to be a core component of operations teams. I think you have COOs at traditional companies, I don’t think you’re going to be able to be a COO unless you have a deep understanding of observability and what it’s telling you about your company.
More and more companies, even those that have a lot of brick and mortar operations, run on software and that software gives you a lot of insight into your business. So, I just see a really interesting growth path from observability manager, to chief operating officer and back down that pipeline COOs relying on their observability teams for strategic insights as they plan out their business growth and operations every year.
Paige: Oh, take me to this future! I want to live in the future you have all painted for us, and maybe the chief operating officer becomes chief observability officer. We can dream.
Thank you to everybody for joining us, and especially to our fabulous expert panelists – Amy, Adriana, and Julia. It has been a wonderful conversation, and I think many people are going to learn from the insights that you’ve shared with us today.
Watch the full on-demand webinar to hear our panelists explore their paths through observability.
