

Why distributed tracing tools haven’t lived up to the hype (yet)
Distributed tracing was supposed to make debugging modern distributed systems easier. For many teams, it hasn’t delivered on that promise. While tracing offers the potential for deep visibility, it often comes with serious tradeoffs, such as high data volumes, opaque costs, and an unclear return on investment.
The root problem isn’t that tracing doesn’t work. It’s that most tools force teams into extremes. They either sample so aggressively they miss the signals that matter, or they try to capture more data than they can afford to store and quickly run into performance or budget limits.
This gap between promise and reality impacts not just platform teams, but also the developers and SREs trying to resolve issues in production. Many practitioners report that distributed tracing tools are:
- Too complex to navigate
- Deliver too much irrelevant data
- Or fail to retain the exact traces they need during an outage
Instead of speeding up root cause analysis, tracing often becomes another layer of noise to sift through during critical moments.
Tracing should be a strategic asset, not a liability. That’s why Chronosphere implemented tracing with a different approach.
The Challenge: Tracing at scale breaks without control
Traces enable developers to see beyond their own service boundaries, tracking user requests across the entire application stack to isolate bottlenecks and errors anywhere in the system. At scale, environments can produce hundreds of thousands of traces per second. Without effective controls, that firehose creates more problems than it solves.
Teams struggle with tracing at scale because:
- Exploding costs: storage and processing quickly become unsustainable
- Operational risk: high-volume tracing can introduce latency and instability
- Signal overload: too many irrelevant traces, not enough actionable insights
- Usability barriers: traces aren’t intuitive, requiring training that creates adoption friction
Even if cost wasn’t the blocker, performance overhead is. Engineers often scale back instrumentation to avoid overloading applications, limiting the value of tracing before it even starts.
And for the developers who rely on traces to troubleshoot issues, the experience can be frustrating. High-value traces—the ones tied to errors, latency spikes, or unexpected system behavior—are often missing, buried, or inaccessible. Navigating massive volumes of low-signal data slows down incident response and forces engineers to rely on intuition rather than evidence.
Chronosphere believes there’s a better way — one that starts with identifying what matters most and controlling what gets saved.
Troubleshoot microservices issues faster with DDx for Traces
DDx for Traces makes it easier for developers to resolve issues without being slowed down by complexity or lengthy investigations.
Building blocks of the Chronosphere tracing solution
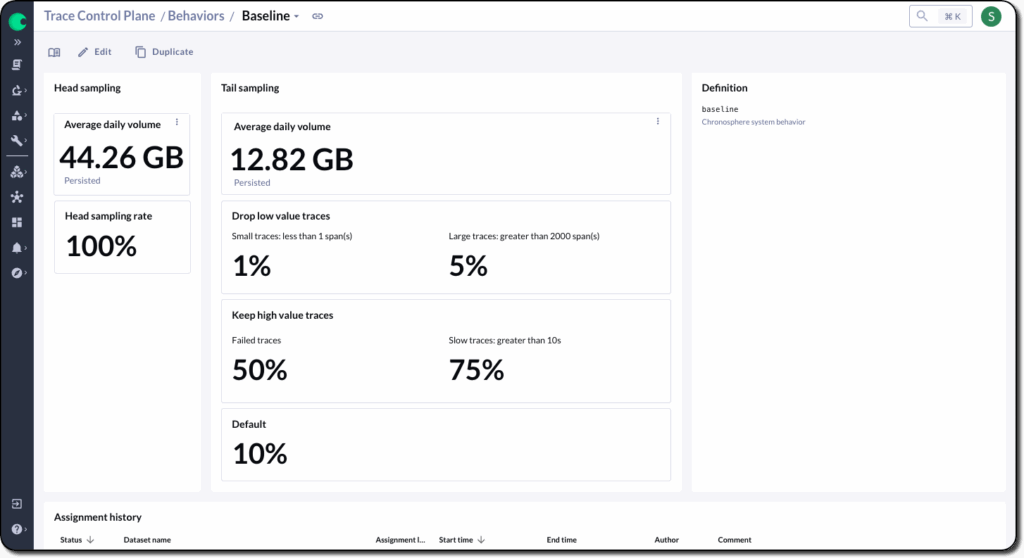
Chronosphere’s Trace Control Plane gives observability teams the controls they need to manage tracing data intentionally — making it possible to preserve the most valuable traces, eliminate waste, and operate within budget.
At the core of this control are a set of purpose-built components that let teams define what data is important, how it’s treated, and when it should be treated differently. These features work together to help organizations shape their tracing strategy around business needs, not technical limitations.
The core components of the Trace Control Plane include:
- Trace Datasets allow teams to segment trace data into logical groups, such as by service, environment, business unit, or any combination of attributes. This segmentation gives visibility into where data volume is coming from and enables differentiated sampling policies. For example, you might store 100% of traces from production checkout services but only 10% from lower-priority internal tools.
- Head-based sampling provides early control over trace volume at the point of generation. It supports probabilistic sampling, rate-limiting, and dynamic per-operation strategies, and is centrally managed. This allows observability teams to apply nuanced sampling logic across services without collector restarts or redeployments.
- Tail-Based sampling operates after traces have been assembled and analyzed, enabling teams to retain only those traces that meet specific criteria, such as error state, latency thresholds, or span complexity. Ordered sampling rules offer precision, ensuring critical traces are persisted while unnecessary data is dropped before storage.
- Behavior-based sampling simplifies policy management by letting teams apply preconfigured, reusable sampling strategies. Behaviors can be assigned to Datasets and modified over time. You can set temporary policies, such as “retain everything” for 30 minutes during an incident, or use scheduled “deny” behaviors to suppress low-value data, like weekly maintenance jobs. This flexibility removes the need to write custom sampling rules from scratch every time priorities shift.
Dive deeper with distributed tracing analysis and insight tools
Alongside these core controls, Chronosphere includes companion tools that give engineers and observability teams deeper visibility into their trace data. These tools help them make informed decisions and respond faster during incidents or optimization efforts.
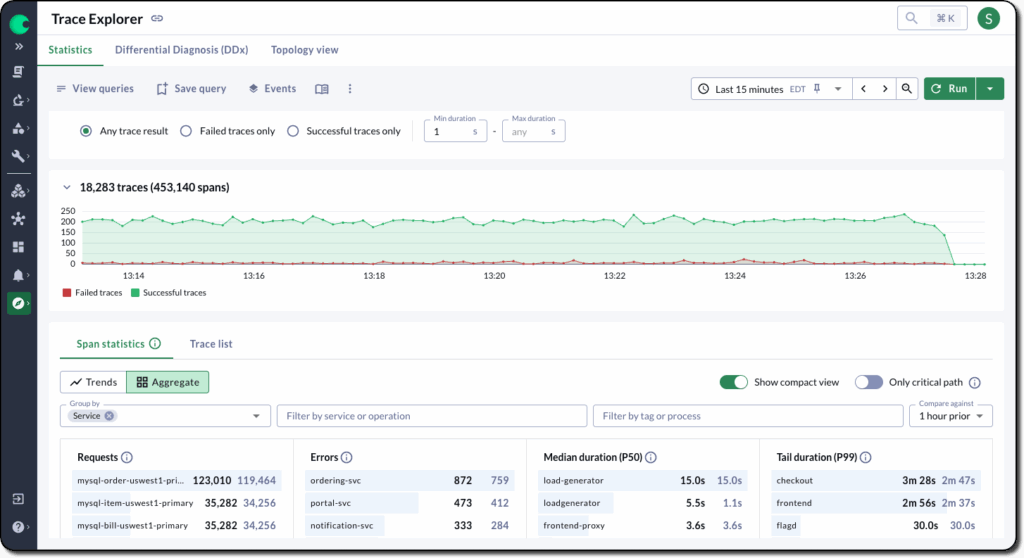
The Trace Explorer makes it easy to search, filter, and inspect traces directly. Whether you’re triaging a production issue or exploring system behavior, you can quickly drill into traces, identify problematic services, and surface the queries that feed into Datasets and sampling rules.
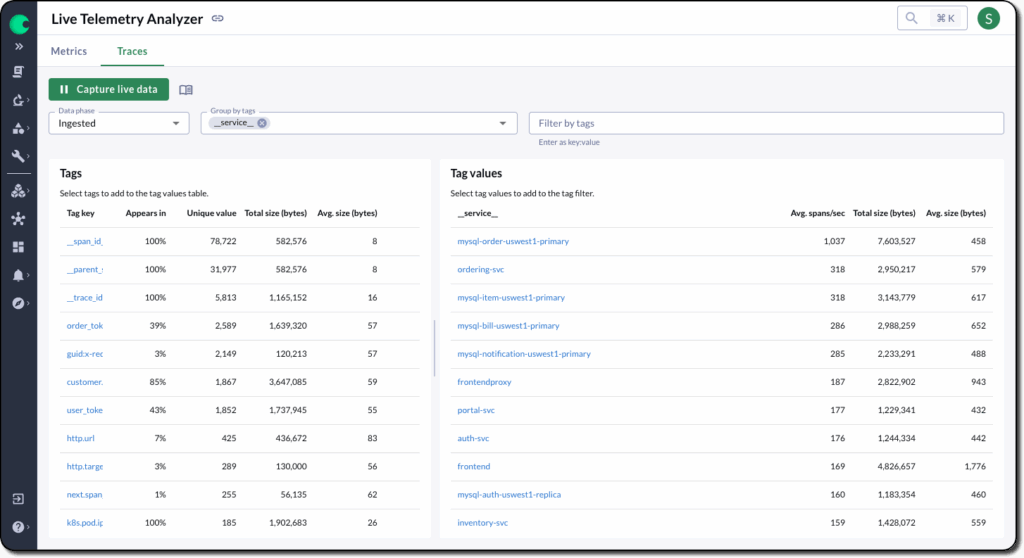
The Live Telemetry Analyzer gives a real-time view into span throughput, trace size, and tagging patterns. It’s especially useful for identifying noisy, expensive, or unexpected trace traffic, allowing teams to measure the impact of instrumentation changes or validate new sampling configurations before they take effect.
Differential Diagnosis (DDx) for Traces removes the guesswork from troubleshooting by automatically analyzing all spans and attributes in a trace. It highlights what’s correlated with a performance issue, and what’s not, so your team can validate or rule out hypotheses fast. With a guided, queryless workflow, anyone can go from symptom to root cause without prior system or data context.
Together, the Trace Control Plane and its companion tools provide observability leaders with the level of precision, adaptability, and clarity needed to make tracing work at scale — without compromise.
Why it matters: Real-world impact for teams
Chronosphere Distributed Tracing is more than a set of technical features—it’s a strategic approach to observability that delivers value across roles and responsibilities.
For observability leaders and teams, it means taking back control of telemetry budgets, enforcing best practices at scale, and aligning data retention with business impact. Instead of being caught off guard by cost spikes or forced into blunt sampling strategies, they can make informed, granular decisions that optimize both performance and spend.
For developers on the front lines, it means faster access to meaningful trace data, especially in moments that matter most. Chronosphere ensures that high-value traces—errors, high-latency calls, complex paths—are preserved and discoverable without guesswork or friction.
When tracing is implemented with intentionality and backed by flexible tooling, it becomes a force multiplier: accelerating resolution times, reducing toil, and increasing trust in the data.
Chronosphere empowers teams to move from reactive, expensive tracing to a proactive, precision-based approach that scales with your systems and grows with your business.
Frequently Asked Questions
What are the primary pitfalls with most tracing tools?
While tracing offers the potential for deep visibility, it often comes with serious tradeoffs, such as high data volumes, opaque costs, and an unclear return on investment. Top issues include: exploding costs, operational risk, and signal overload.
What are the building blocks of the Chronosphere tracing solution?
- Datasets
- Behavior-based sampling
- Dynamic head-based and tail-based sampling for trace cost and data volume control
- Differential Diagnosis (DDx) for Traces for simple troubleshooting for developers.
How do Chronosphere’s distributed tracing capabilities help teams?
Observability leaders are better able to control telemetry budgets, enforce best practices at scale, and align data retention with business impact. Developers get faster access to meaningful trace data, especially during critical moments.
Is Chronosphere Distributed Tracing a good alternative to Lightstep?
Yes. Both platforms support OpenTelemetry, so if you’re already instrumented, there’s no need to re-instrument your services, making the switch fast and low-friction. To make your transition even smoother, Chronosphere’s Customer Success team offers guided migration support to minimize disruption to your teams.
Ready to see Chronosphere Tracing in action?
Schedule a demo to see how Chronosphere Tracing helps you go from data overload to operational clarity.