")

TL;DR
Metric aggregation, using things like Recording Rules, is great for performance and makes queries easier to work with. But it comes with an annoying, hard-to-solve side effect: once a metric is simplified, it’s hard to figure out what data it actually came from.
At Chronosphere, we’ve lived with that side effect just like everyone else with a Prometheus-compatible metric backend. That is, until now. I wanted to take some time to talk about X-Ray: a tool that lets you peel back layers of derived telemetry and get to the underlying queries.
Life before X-Ray
At Chronosphere, we’ve been living with a long-standing annoyance: once a metric is abstracted behind another simplified metric, using something like a Recording Rule (RR) or a Derived Metric (DM), it’s incredibly hard to connect the two together to figure out what underlying metric data actually is. This was never ideal, but we tolerated it. It was just one of those little annoyances that flew under the radar. We just didn’t think about it.
The situation went from slightly annoying to downright frustrating when we built our internal SLO system. Even though it was a system we understood and controlled, it still required a lot of time and work to use the chronoctl CLI commands and manually scan YAML to get to the information we needed. The pain was real, but localized. So we continued to live with it.
Once we started building our customer-facing SLO feature, as well as Differential Diagnosis (DDx) for Metrics, we realized we were about to export the same problem to our customers and put a spotlight on it. Our customer-facing SLO feature heavily utilizes DMs and RRs under the hood. DDx for Metrics requires visibility to metric dimensions to conduct correlation analysis in order to highlight what changed and what didn’t. Metrics produced by RRs and DMs often have a limited set of dimensions, making DDx for Metrics far less effective in surfacing anomalies. We were really excited about both of these features, but they just didn’t work together. Not ideal.
What’s needed
We needed a way to look at a query and recognize when it is built on layers of derived telemetry, and to peel back those layers. It not only had to be able to see through those layers but rewrite and substitute those queries to the lower-level equivalents that likely have more dimensions on them (labels / values).
To do this, my team developed X-Ray: a tool that enables you to take any query using derived telemetry produced by DMs or RRs and follow it back to its original source. Here is how we did it.
The Problem: Derived telemetry is a black box
Here’s a scenario our engineers know well:
An SLO burn rate alert (defined by a recording rule) fires. As the on-call engineer, you open Metrics Explorer, but find nothing but the abstracted metric name with very few dimensions. It looks something like this:
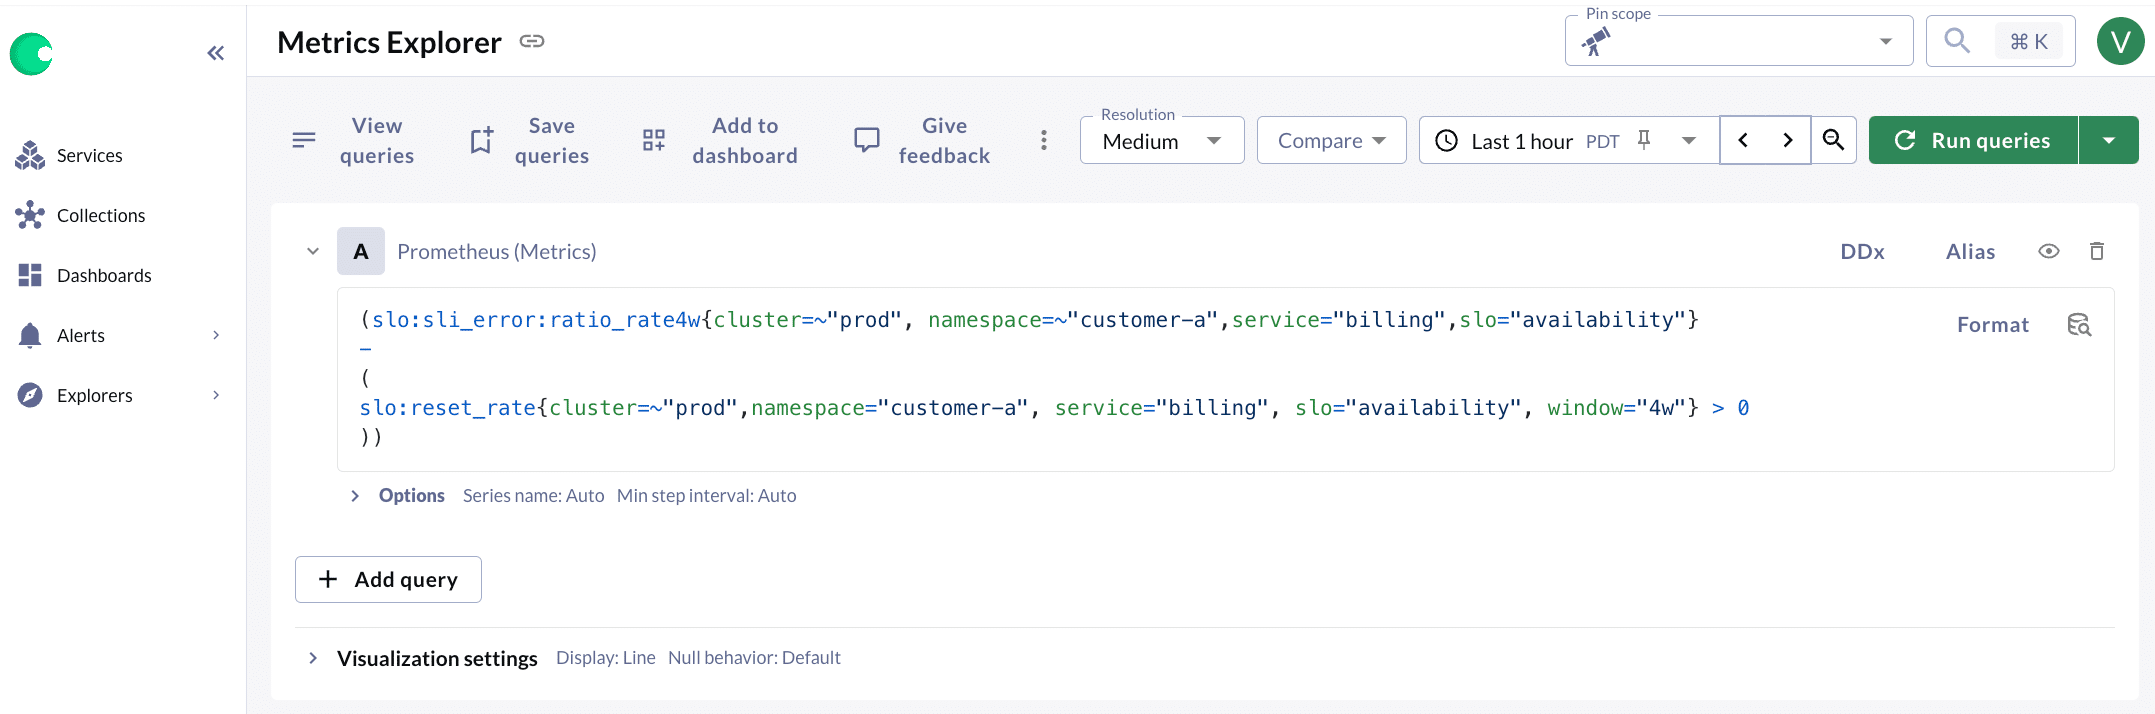
Figure 1. Chronosphere Metrics Explorer
Very unhelpful. You try DDx, but that doesn’t really give any new information, because the original cardinality was aggregated away. At this point, your only recourse is to:
- Guess that the metric was generated by a recording rule.
- Dump all RR definitions via
chronoctl recording-rules list > rr.yaml. - Manually look through YAML to find the match.
- Copy the PromQL expression back into a query window.
The whole thing can take 15–30 minutes, and that’s if you already know your way around the system and the recording rule is simple. RRs and DMs can be much harder to reason about if they are more complex:
- RRs and DMs can be defined in terms of other RRs and DMs. This means you have to go through the above process again to find the real root metrics
- DMs have “variable selectors”, which can be provided by the query or use a default. For example, if the DM maps
real_metric{$env}(with the variable$envdefaulting toenv="prod") todm:metric, then a query todm:metricshould be replaced withreal_metric{env="prod"}and a query to a query todm:metric{env="test"}should be replaced with real_metric{env=”test”}. When you are trying to manually recreate a query, you need to keep these in mind and make sure you are using the correct value. - RRs can reuse a metric name. This means just searching the
chronoctloutput for the metric name is not enough. Each RR adds a hardcoded set of labels to each datapoint it records, so you have to look at these labels for each and every RR manually to find the exact one that matches your current case.
With all this complexity, you wind up wasting a lot of precious time just to understand what the metric even means, let alone what caused the alert. This is inefficient, error-prone, and just plain frustrating.
Manning Book: Effective Platform Engineering
Learn actionable insights and techniques to help you design platforms that are powerful, sustainable, and easy to use.
Technical challenges and how we solved them
When I first started prototyping this feature, it seemed like it would be relatively straightforward. After all, we have all the RR and DM definitions in our DB already. All we have to do is just, like, undo it. But, as with most engineering problems, it is far more complicated than it seems on the surface.
One challenge we came across was that DMs and RRs can be nested arbitrarily. This usage pattern was far more common than I would have thought, so it was the first problem we had to solve to make the feature usable. So given a Prom query, we’d have to:
- Parse it
- Get all distinct metric names
- Check if each name was a DM or RR
- Get the Prom query for each of those names
- Recurse
Laid out like that, it became clear this was just a tree-traversal problem. That’s no biggie! The prototype used a recursive depth-first traversal to build a derived telemetry tree data structure. Problem Solved 🙂…
Except, the prototype UI with a tree-like display was useful to me because I like seeing all the layers at once. However, only a few of the folks we showed it to were able to interpret it.
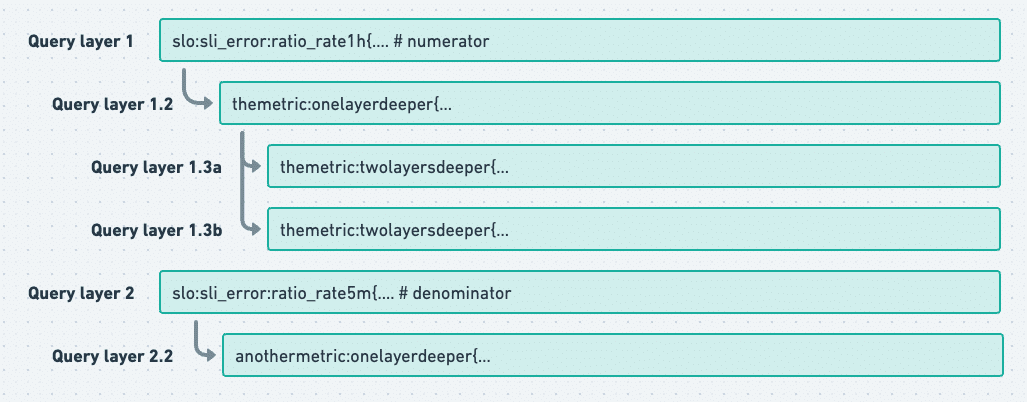
Figure 2. Example of the nested query tree UI. In some cases one query can be made of derived telemetry that references other derived telemetry.
This leads to the next challenge: How do we make a usable UX for this feature? The engineering team loved seeing all this data up front, but we are too close to the system. We had to accept that this just wouldn’t be useful for actual users.
So what would be useful? Maybe we could show the data “one layer at a time” to prevent information overload. But what does that even mean? Do we pull the child expressions into the root, and fully replace all derived telemetry in the current query with their original expressions? Or do we only explore one branch at a time, and allow you to focus on only one of the derived telemetries?
After a lot of back and forth within the engineering team and our product manager, we ultimately landed on showing users all of the child expressions of the current query, and allowing them to follow only one of those children at a time. This keeps information overload to a minimum while still allowing the user to peel back as many layers as they need.
Finding the best approach
This decision made us realize that a depth-first tree traversal was not the correct approach for what we needed to accomplish, and so we scrapped the tree traversal and replaced it with an API that simply returns all child expressions of the given expression. If the user wants to peel back more layers, we would submit the child expression to the API again to get the next set of children. Problem Solved 🙂…
Except, the prototype isn’t handling two of those complexities I mentioned earlier: DM variable selectors and duplicate RR names. Results can be downright wrong if these issues aren’t handled. Luckily, we already handle resolving DM variable selectors in our query engine. We just needed a refactor to make that logic reusable, and that problem is solved.
Duplicate RR names is a trickier problem to handle. It turns out that there is no way to uniquely identify a specific RR definition from a Prom expression. The closest we can get is using the metric name plus the recording rule labels. Because of this, we can get into a situation where there are multiple RR definitions that are applicable to a given Prom expression, so how do we resolve this? Well, we have to approximate. If we make the assumption that two Prom expressions, A and B, each produce a distinct set of series from each other, then the Prom expression A + B should produce results equivalent to Result(A) ∪ Result(B). This assumption is not necessarily true for RRs, but it’s a reasonable assumption for the use cases we see. Problem Solved 🙂…
Except, the prototype just loads every DM and RR into memory and does a linear search by metric name every single time. That just won’t do for production. Some of our customers have hundreds of thousands of RRs and DMs. Doing a linear, in-memory search on this much data is a bit slow, and it gets slower the more metric names in the query that we need to look up. Now we need to make querying DMs and RRs efficient.
Once again, this is easy for DMs. Metric names are globally unique for DMs, so we just need to make a simple unique index in our DB. Once again, RRs are more difficult due to their lack of uniqueness. Relational Databases 101 says for such a use case, it would be best to use a simple intermediate table like this:
| rr_id | metric_name | label_name | label_value |
|---|---|---|---|
| 1 | slo:sli_error:ratio_rate1h | service | chrono-metrics |
| 1 | slo:sli_error:ratio_rate1h | slo | availability |
| 2 | slo:sli_error:ratio_rate1h | service | derivedmetric |
| 2 | slo:sli_error:ratio_rate1h | slo | availability |
We would then construct a simple SQL query based on the given metric and selectors. If the given Prom expression was rr_metric{service="chrono-metrics, slo="availability"}, we could get applicable RRs using a query along these lines:
SELECT rr_id
FROM rr_labels
WHERE metric_name = 'slo:sli_error:ratio_rate1h' AND (
 (label_name = 'service' AND label_value = 'chrono-metrics') OR
 (label_name = 'slo' AND label_value = 'availability')
 )
GROUP BY rr_id
HAVING count(DISTINCT label_name, label_value) = 2
Except, there is an important caveat here that this simple query can’t handle: we don’t know which selectors in the Prom query correspond to “real” labels and which correspond to RR labels. This SQL query will fail if any of the selectors are not RR labels (e.g. rr_metric{service="chrono-metrics, slo="availability", pod=”abc-123”}) OR if we fail to provide any of the RR labels as selectors in the Prom expression (e.g. rr_metric{service="chrono-metrics}). This SQL query needs to be more lax, and thus more complicated. We can’t say for sure whether a set of selectors definitely matches an RR, but we can disqualify RRs that definitely do not match. So we came up with this:
SELECT DISTINCT rr_id
FROM rr_labels
WHERE rr_id NOT IN (
   -- This subquery looks for all RRs that are explicitly disqualified from matching against our input
   SELECT DISTINCT e2.rr_id
   FROM rr_labels e2
   WHERE e2.metric_name = 'slo:sli_error:ratio_rate1h' AND (
	 (label_name = 'service' AND label_value <> 'chrono-metrics') OR
	 (label_name = 'slo' AND label_value <> 'availability')
	)
  )
AND metric_name = 'slo:sli_error:ratio_rate1h'
Except, there is another, more frustrating, caveat that this query cannot handle. Some selectors use regexp (like service=~"(chrono-metrics|derivedmetric)" . You would think this would be as simple as making the above query look like (label_name = 'service' AND label_value NOT REGEXP '(chrono-metrics|derivedmetric)'), but no. We have a regexp pattern that comes up a lot in Prom queries on our platform that looks like (|option1|option2), but this is not a valid regexp in MySQL 5.7. It works in MySQL 8, which our infra team is hard at work migrating to, but for now, we need a workaround. That workaround is to pull the disqualification logic out of SQL and into code. It’s certainly slower and more verbose this way, but it will get the job done until we are fully migrated.
Finally, after all these challenges, it works! Now we “just” have to backfill this table and keep it up to date. That is a whole other can of worms that another one of our amazing engineers spent weeks optimizing, but I won’t go more into that here.
Real example: What X-Ray fixes
Before X-Ray:
- An alert fired on slo:sli_error:ratio_rate1h.
- DDx showed no details due to aggregated telemetry.
- You had to dump YAML and manually search for the right RR.
With X-Ray:
- Click on the metric.
- See the exact PromQL used to generate it.
- All selectors are merged automatically.
- Drill into the upstream metric using DDx.
Figure 3: X-Ray peels back the layers of derived telemetry to get to the underlying data and its dimensions.
What’s next
It’s early days for X-Ray. We see a growing number of ways and places we can use this new capability across our platform. A few of the things we looking at next are:
- Multi-layer traversal: Optional full-tree expansion for power users.
- Traceable audit logs: See how RRs/DMs evolve over time.
- X-Ray everywhere: Run X-Ray anywhere you can read or write a Prom query
Find Out How DDx for Metrics Can Help You
Peel back layers of derived telemetry and get to the underlying queries that matter the most.