

TL;DR
- Where data is in Saved Objects and Lens Objects
- How to extract data from Saved Objects and Lens Objects
- Ways to approach data webs and data disorder
- Why its powerful to get your data how you want it
Where and when did this talk take place?
This session was recorded live at OpenSearchCon North America 2025, held September 8–10 in San Jose, California, at the Signia by Hilton. The event brought together the OpenSearch community—including users, administrators, and developers—to share insights, explore the future of open source search and observability, and collaborate on real-world challenges.
What was the focus of the talk?
In this talk, Sarah Hudspeth (Solutions Architect) and Jason Ng (Implementation Engineer) from Chronosphere unpack their hands-on experience migrating from a proprietary Kibana instance to Chronosphere. They share the automation and tooling their team built to extract, convert, and restructure complex filters, queries, and nested JSONs from Saved Objects and Lens dashboards. The session includes a live demo of their migration tooling, lessons learned about handling tangled data schemas, and recommendations for avoiding vendor lock-in while preserving data ownership and query fidelity.
Meet Sarah and Jason
Sarah Hudspeth:: Hi I am Sarah Hudspeth a Solutions Architect at Chronosphere, on the post-sale side. We do a lot of vendor SaaS vendor migrations to Chronosphere which has a lot of open source telemetry.
I’m a really big, data nerd. I love books as well, and I’ll let Jason introduce himself.
Jason Ng: Hi, I’m Jason Ng, I am an Implementation Engineer. I work with Sarah on the post-sales team. She put down that I’m a script guru, I’m not sure I’ve reached that level quite yet! I also like to run marathons, so running long distances.
Agenda
Sarah: A quick agenda for today. We’re going to get into all the data tangles that we ran into when we were migrating a customer from Elasticsearch.
We’re going to have a discussion about our approach to untangling it. It’s not the only approach, we’re gonna talk about why we approached it that way.
There are probably better ways to approach it and we’re open to feedback.
Then we’re going to go through some of our successes, some of our failures and our learnings. Then get to a demo and leave some time for questions. So hopefully you’re ready for all that!
Basically what we want you to take away from this presentation is to understand where data is in Saved Objects and Lens Objects and how you can extract it.
We want to have this discussion about how you approach data webs.When data is unruly, how do you solve for that? How do you work through some of the disorder and the craziness that happens? We want you to leave feeling like, it’s really awesome when you have your data and you can use it how you want to, and it’s not stuck in some format and you can have fun and play with it.
Lastly, we don’t want you to be intimidated by these data schemes. We were very intimidated by them. Hopefully you’ll take something from what we learned and start way farther down the road than we did and have fun playing with them.
Always turn left

Sarah: I don’t know if you all remember one of the first labs, in AP Comp Sci. For me it was Intro to Java 101, but basically you had to program a pathfinder in a maze. You had to get the red dot to the blue dot or the blue dot to the red dot. And you had to write the algorithm or the logic to make that happen for any maze the lab ran. If you remember the solution was just always program the dot to take a left hand turn. Right? It’s not the most efficient way, there’s probably a shorter path through the labyrinth or through the maze, but it’s thorough and it always gets you out of the maze.
This is the metaphor for the approach we took. We tried to figure out what is always going to be the “left hand turn”. How can we be thorough in our data and make sure we understand what’s happening?
For us, we work with a lot of different SaaS vendors, we’re moving customers from one vendor to the other. Often we’re also moving them to open source and sometimes when we get into their data, we really have no idea what’s going on, right? We’re in this space we don’t know what’s around the corner and so we have to have this approach of always touching the left hand wall, making sure we’re being thorough even as we come across unknowns.
This is what we did with the Elasticsearch/OpenSearch data. We really tried to build from the ground up what was going on with these dashboards and login queries. I should say we did have programmatic access to get them all out
Basically we didn’t know what the data looked like. We were trying to add order to it and this is our story.
Data tangles
Sarah: To start off this story, I’m actually in the OpenSearch playground right now and this is a logging dashboard. We had this imperative to get all these log queries out and into the open to redo them.
First step, right? You’d be like, okay, let’s go take a look at these queries.
Alright, let’s start trying to find where these queries are first.
You would go to inspect, you would get data, but then you’d have to go to Requests. Requests are looking a little bit better, it looks like we have an index pattern that can be a source, that can be a start of a query. But then when you click into Requests, alright we’re getting some JSON. We have some information, but if you take a deeper look at it, there’s a lot going on in here.
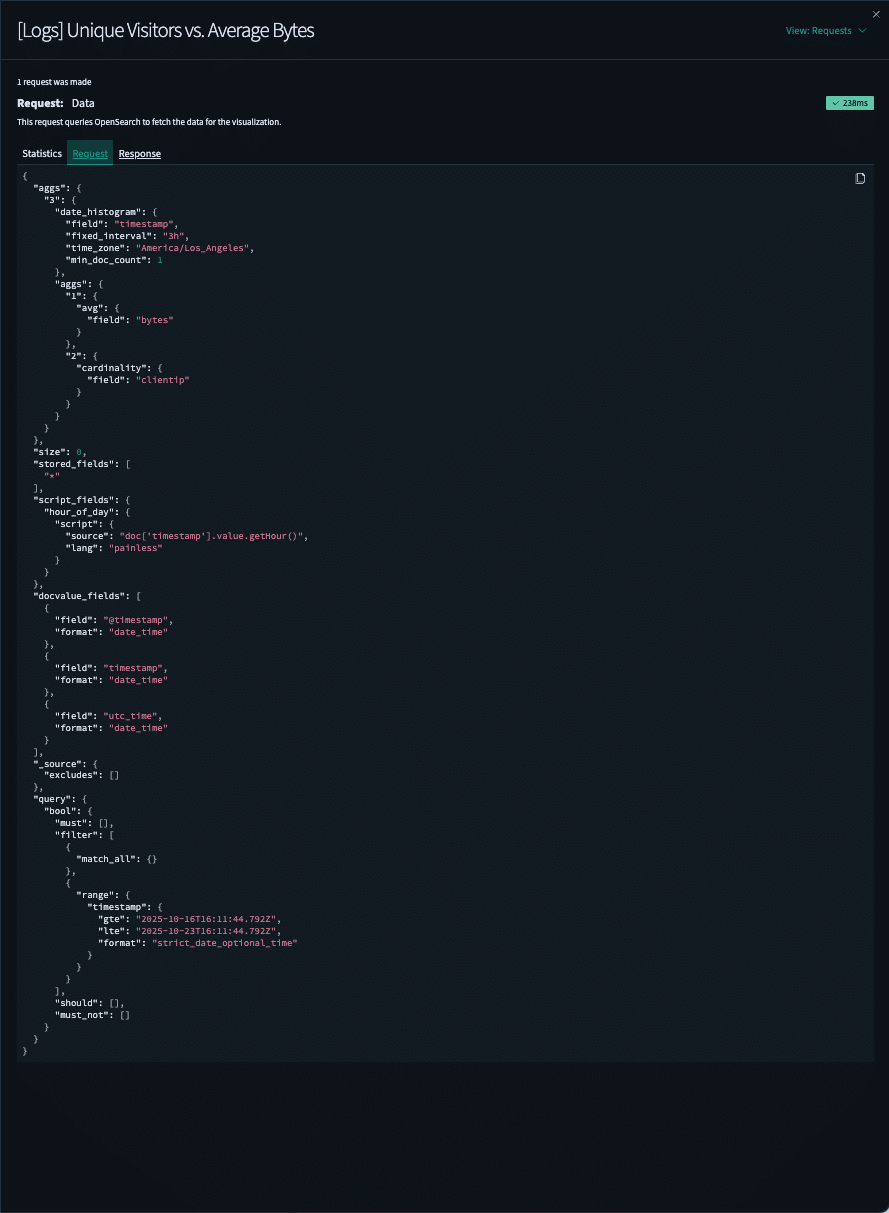
Here we have a query and we have bool, all these filters, matches, and we have should and must_not. But at the same time, we have all these other fields that we have to be aware of and make sure that we’re understanding, like here’s a source that’s probably important.
For this talk, we’re talking mostly about how to extract queries, but we also had to extract the data visualization information. We would think about getting the aggregations and looking at the histograms and all of this information. We had to grab it and map it.
So this looks like a pretty nice JSON, right? Let’s take a look at what we would need to do in order to get access to it programmatically.
You’d have to go to Dashboards Management to Saved Objects, you would have to find the dashboard that you wanted and then you’d have to export it and you could include related objects or not related objects.
This is where it became interesting. Sometimes you needed those related objects because the dashboard would reference an object and you didn’t know where it was and you had to go find it. This is the start of the journey trying to figure out how we are going to move all these queries into a new format?
I like to use Jupyter Notebook for my data analysis prep work so I loaded those newline delimited JSONs you get from Saved Objects and tried to start bringing order to it.
Here’s a bunch of JSON I put in a data frame you can see, where we’re getting some interesting information about the different types of objects: index pattern, visualization. We have an interesting thing called attributes. I could start pulling dictionary keys that could maybe point back to that JSON that I saw in the dashboard.
It actually ended up being way more complicated, there are no official tools if you want to extract data. There is a tool that will take you from Elastic to OpenSearch on the OpenSearch website. If you just want to find the queries to play with them, for instance if you wanted to redo any of your queries into the new Piped Processing Language (PPL), there’s no way just to get the queries. You’re just going to get another JSON.
It looks like there’s standard query type syntax, but in the next slide I’ll show you actually, there’s not. The logic it stores switches on you all the time. There is a ton of drift between the Kibana versions of these visualizations and Lens and dashboards and there’s no backwards compatibility.
We were really struggling a lot to figure out how we were going to organize everything. Note that a Lens Saved Object, OpenSearch uses the visualization, but with Elastic there’s like a bunch of visualization layers you can add, which adds to the complexity of the nice nested JSON.
JSON tangles
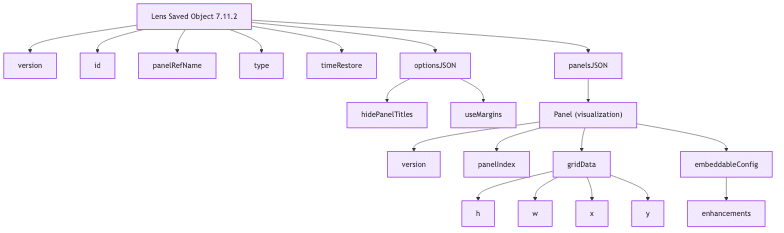
Sarah: Here are some examples of the JSON we pulled. Title, panelsJSON version, gridData, panelIndex, these look like basic building blocks of dashboards but they quickly change from one version to the other.
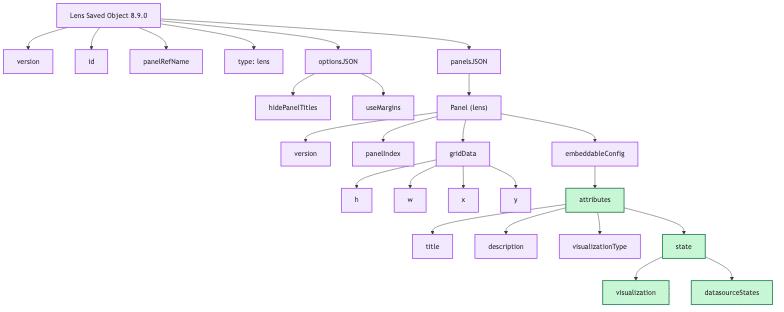
So here we have a new type: visualization. We have some more attributes down here we switch back to Lens. It still seems manageable, but then when you get into even later versions, all of a sudden, the places you have to look for the information just gets crazy.


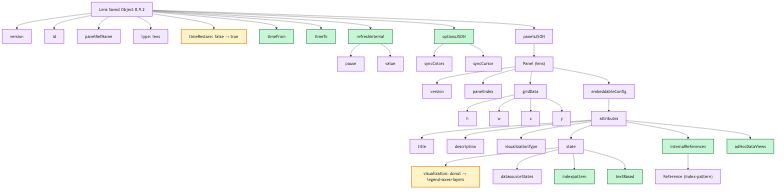
Again, not every dashboard uses the same thing. What we found is within a dashboard, there will be different versioned Lens and Saved Objects that you have to then organize and figure out.
That was the setup and I’m going to pass it off to my colleague Jason, who’s going to talk to you about how we figured out how to work with all this data.
Untangling Data Webs Step By Step
Jason: So approach to untangle, as Sarah alluded to, these newline delimited JSONs, they can be intimidatingly complex.
However, I really feel like just keeping calm, having a proper and good problem solving process really helped us, especially with regards to speed. When we are doing migrations it’s not on the order of years or months, it’s literally like figure out in weeks. Our team along with the engineering team, we pretty much figured this out in one week.
Having a really strong problem solving process, understanding the problem, first off, makes things a lot easier later on.
What that meant was
- examining the JSON object
- looking at the UI to see what options there are and how users interact with it
- using documentation to fill in the gaps
- listing a lot of the examples: what fields or values do we need to recreate the same data one-to-one, for our customers in Chronosphere?
That evolved for dashboards, like what visualization you want. Is it a timeseries? Is it a bar stacked? Is it something that we don’t support?
For some of the alerts we weren’t able to do, we don’t currently support doing like composite alerts, but we will in the future.
Then the query, what filters, aggregation, group by, step size, limit we want and alerts like thresholds and sustain are important data points that we also need.
Being able to do these things then means that we can then figure out what data structures we need to manipulate the data to get us to those complete and accurate queries and the algorithm we need for the conversion.
Data order successes
Jason: That leads to really what we feel is one of our biggest successes, which is having an automated conversion pipeline to reduce our manual efforts.
As an IE (Implementation Engineer) we do a lot of the last mile validation, for things that we cannot automate. Having something that is automated so once we extract out that data and manipulate exactly how we want it. That really makes my life and the other IE’s life just so much easier. The 80% is really something more that we feel rather than something objective and we see in our demo, just how quickly we can move hundreds or even thousands of dashboard and alert assets
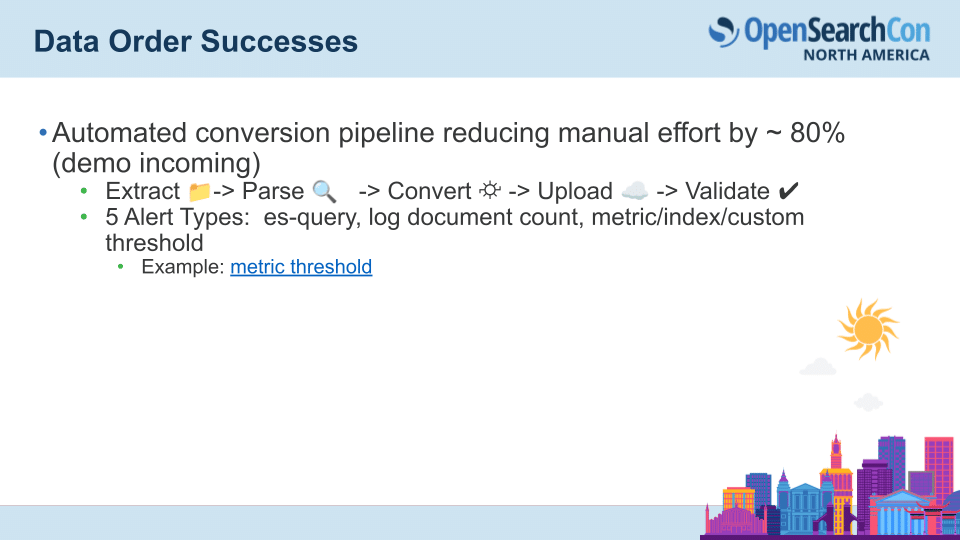
That really means extracting them from a tenant, parsing them, converting them to Chronosphere’s spec, uploading them to our tenant and then we do the final validation. Something to call out is our success in dealing with not only the dashboard JSONs, but also the alert JSONs, like these five types es-query, log document count, metric, index and custom threshold.
If we were to take a look at metric threshold alerts, this is a document which goes through our understanding of the problem process.
We define:
- what a metric threshold query is
- go through the documentation how it works in the Kibana UI
- how to translate that into a Chronosphere spec
- Where do we find the criteria for the alerts? It’s gonna be in this params.criteria field
- Where are aggregations?
A big data challenge that we had was the number of different paths that an alert can take.
For instance, one path can have a single criteria for the alert, and in this case a custom aggregation type that’s typically associated with an equation. So for this we have a B / (A + B). We need to find out where the filters and the aggregations for B and A are then be able to turn that into this Chronosphere spec, for which we actually substitute those filters and aggregations for, for that particular equation.
It’s not even just this one case. We can have a static aggregation type, so like a count. So a count of log documents, we can have an average, but we can also have this other path, which is we have more than one criteria. We can have two criteria, three criteria, and each of them can be a custom aggregation type with an equation. Or we found that it can not have an equation – that was an edge case we saw that actually just defaults to a count.
Being able to really understand the problem leads us to be able to create that automated tooling.
Jason: I’m going to get into a very quick demo on our tooling in action to be able to turn that messy JSON into our desired output of a very clean logs query in Chronosphere. This is our migration engine and we’re gonna be converting a bunch of dashboard and alert assets.
This one click of a button is gonna upload, parse, convert and upload a whole bunch of assets to our tenant. This is our test tenant. We converted and uploaded 11 dashboards here for one of our collections, and 74 out of 75 alerts. It is definitely not perfect. We missed one there. If I check the log somewhere, in red, print it to the console. Yeah. For one of our alerts, we ran into an error, which we’re gonna have to fix before our next Elasticsearch or OpenSearch migration.
I think for this one, we have a string and we’re trying to use it like an operator greater than equals in and the data was extracted correctly, but we need to do a little bit more work to get them to Chronosphere spec.
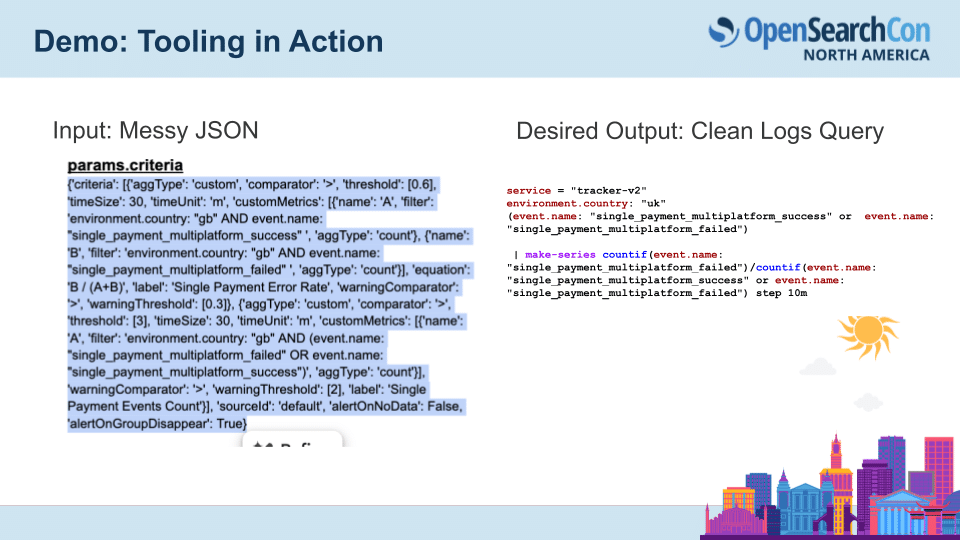
Our goal was to get to this a very clean logs query from what it was in Elasticsearch.
Lessons Learned
Jason: Migrations are definitely a bit of archeological digging, plus a bit of engineering. Some of our learnings:
- Audit your objects as early as possible, don’t wait until migration time. Our team worked pretty much from the very start to be able to audit objects and figure out a migration path for them.
- Finding that hidden complexity in the filters and the queries and translating that to an automated tool.
- Testing at scale with those hundreds and thousands of assets to be able to get to the bottom of some of the bugs and edge cases like the one we just saw.
- Understanding like we want to be able to understand the data under the hood
- Own the queries and not have the vendor schema own us.

Why does this matter?
Being able to extract that data, whether it’s for our use case, for us an observability migration, but it could be really for any use case, having the data be complete so that there’s no missing logs.
Having accurate mapping so that the queries paint the dashboards or the alert visualizations and they return what the users expect.
Establishing trust in those dashboards and alerts.
When you start to develop tools like this to be able to convert to different formats it prevents things like lock-in or we, something that we even have is like the ability to translate Chronosphere back to something like Grafana, so future proofing and preventing that lock-in.
Thank you.
Watch the full recording on YouTube
Q&A
Are you open sourcing your tool?
Sarah: We plan to as soon as we get through the current migrations we’re working on, yes. We want to put it out there so folks can use it and grab the queries however they want to. That’s the plan.
Will you open source under the OpenSearch project or under Chronosphere?
Sarah: I think we would either do it under OpenSearch or just open source in general. I don’t think it’d necessarily be under Chronosphere. Because it’s not necessarily Chronosphere specific.
We already have a repository OpenSearch project called OpenSearch migrations where you can replay from Elasticsearch traffic to, there’s also a dashboard migrator tool. It’s not as sophisticated but it does the majority.
Sarah: We noticed that, and, we still needed to get it out of the nested JSON format, so that we could play with them and change kind of the query language. I would say that KQL for Kibana was very convoluted where you were supposed to figure out the query so that we could consolidate it. And I’m sure in OpenSearch, as I pointed out, there’s sometimes you have to connect all the dots and all the pieces to get a query that’s complete.
But yeah we hope to add to that tooling.
How did you convince yourself your migrated JSON target objects are actually what, I mean it’s represented the original source or maybe even how did the user accept that this is what they want? How did you come from? What kind of testing?
Sarah: our validation process is actually rather manual. So we had spreadsheets of everybody’s alerts and dashboards, and then we had links to the old one and the new one. And a lot of times it was, visual validation, like comparing them side by side and then finding and taking notes on the differences.
For the alerts I think it was the same. Sometimes we also see there’s a time where they’re, dual firing, and so we confirm that the alert fires and it’s replicated across both systems before they cut one over. Yeah, that’s another talk.
How do you automate the validation process? We would love to know because that did require a lot of manual validation
Jason: A migration challenge is the customer desire to have perfect one-to-one parity and as quickly as possible. that is gonna demand like at least some level of manual effort for that
Nowadays with LLMs everywhere are you thinking of using LLM’s in some way, shape, or form to make future migrations easier?
Sarah: Yes. So in our current migration, we did use, I don’t know, are we allowed to say what we, anyway, yes, we used some AI to help write the tool, versus Jason and I writing the tool. It was mixed, I would say, especially since we’re open source. So we’re Prometheus for metrics, OpenTelemetry for traces, and then Fluent Bit for logs. PromQL is really hard to translate and even from Victoria Metrics, which is like a superset of PromQL it’s really hard to automate that.
We did write a tool that got us like 80- 90% there, but there’s still a lot of manual work with queries ’cause it’s just, it’s a pain of a language. I have on my to do, to try to write a script that would actually call the data and try to validate it and see if we could have a tool that crunches the numbers and says, yeah, these are returning data within a certain confidence level of being statistically similar.
Manning book: Platform Engineering on Kubernetes
This book uses open source solutions and best practices from the Kubernetes community to help you with cloud native challenges.


