")

Having too much observability data can be like having too much rain.
Too much observability data can impact your network, increase your expenses, flood your data stores, and make it really hard to see how your applications are performing, or what caused an outage.
And it can happen similarly to the way rain unexpectedly increases from a small amount to a deluge, and all of a sudden things are out of control.
This can especially happen when moving from traditional, monolithic applications to microservices, as we did at Citigroup. Traditional observability tools are engineered for monoliths, not microservices.
Monolithic Application Observability
With traditional monolithic applications, you want to capture information about the entire application’s consumption of CPU, disk, memory, network bandwidth, and other operating system resources to be sure the monolith has sufficient resources to perform as expected.
And then when the application is running in production, you want to collect information to confirm that the monolith is running well, and alert you if it’s reaching a resource limit that might cause an outage, or a degradation in performance.
And you also have to set up the logging, monitoring, and alerting required to notify you when an incident or outage occurs, so you can analyze and respond to them quickly, and implement protections that prevent the incident or outage from happening again.
For a monolithic application (or set of monolithic applications), the observability scope is the monolith you’re observing. You are getting an aggregate view of the impact on system resources of all the functions running within the monolith, as illustrated by the three monoliths in Figure 1.
And this is a lot of data but not yet too much. A steady rain, to return to the analogy, but not a flood or blinding downpour. Not too much for the gutters, drainpipes, and storm drains to handle, so to speak. But also not very helpful at the level of each function within the monolith.
At Citigroup we had built infrastructure and assigned teams to operate the monoliths, using observability tools designed for that environment.
Microservices observability
But observability approaches designed for monolithic computing don’t work for cloud native microservices, as we discovered when we began re-engineering our monolithic applications. The steady rain of observability data becomes a downpour and you end up with an unmanageable flood of data.
If you use the same observability tools and collect the same amount of data for each microservice as if it were a monolith, pretty soon you have too much data, and can’t easily see what’s going on with the microservices based applications.
This can easily lead to an uncontrolled environment in which costs are too high, it takes too much effort to understand whether the application is running well or not, and too much time to analyze and respond to incidents and outages.

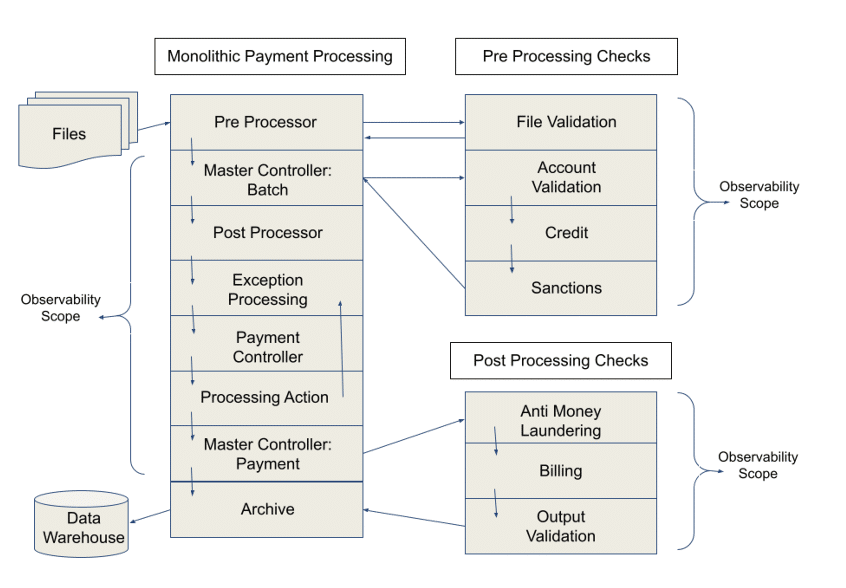
Figure 2 illustrates the modular redesign of payment processing flows for Citigroup’s Treasury and Trade Services division as a blueprint for migrating the monolithic applications to the cloud, using microservices, containers, and Kubernetes. The diagram illustrates the change in observability scope.
Collecting all of the data from the increased number of microservices observability points is one thing, but understanding the data in the context of the application is quite another thing.
The applications now consist of multiple workflows that invoke different sets of microservices, depending on payment type, geography, etc.
An inability to handle the significant increase in observability data volumes and correlate the data to applications composed of microservices – often with multiple applications invoking the same microservices – leads to a loss of control over the applications, an increase in cost, and a decrease in the ability to respond quickly to incidents and outages.
The payment systems are increasingly required to process high volumes of low value payments, such as rideshare driver payments, payroll payments, social security payments, short term rental payments, and so on. And in real time.
The business also has a requirement to autoscale up and down to keep costs in line and handle unexpected spikes in volume because multiple batches of payments can unexpectedly arrive on the same day, due to varying payment calendars. This means a new set of data for the observability infrastructure to capture and analyze, especially when autoscaling doesn’t work.
If we follow the traditional observability and telemetry approach, we end up with a vast flood of data that impedes understanding the characteristics of the application, since the application is now of multiple microservices and workflow engines. The vast flood of data interferes with the ability to triage and remediate an incident or outage.
Modern, microservices based applications require modern observability solutions, such as those from Chronosphere and Google Cloud, which are specifically engineered for collecting and managing the flood of observability data to help you stay in control of your costs and your applications.
The Intellyx Take
Modern applications live in a very different world than applications built just ten or twenty years ago. Cloud native infrastructure has significantly different characteristics than traditional “scale up” infrastructure. Applications engineered for cloud infrastructure perform significantly better than those that are simply “lifted and shifted.”
The same is true for observability solutions. Those designed specifically for cloud infrastructure, such as the solutions from Chronosphere and Google Cloud, perform much better than observability solutions designed for monolithic applications.
It’s all too easy to lose control over your applications in the flood of observability data traditional solutions generate. These modern observability solutions help you quickly understand whether or not your system needs additional resources, and quickly diagnose and repair incidents and outages.
If you “lift and shift” your observability solution from the traditional monolithic environment for which it was designed, you will end up with an uncontrollable flood of data.
If you want to be in control of your apps, your data costs, and your incidents and outages, it makes sense to adopt an observability solution designed for modern environments, such as Chronosphere and Google Cloud provides.
Copyright © Intellyx BV. Chronosphere is an Intellyx customer. Intellyx retains final editorial control of this article. No AI was used to write this article. Image credit: Vung Nguyen on Pexels.


