

Open-source cloud native (Kubernetes and containers) and edge computing are emerging as a killer combo for many organizations, especially for brick-and-mortar retail and hospitality. Successful edge computing deployments reduce costs, boost performance, and improve customer experience. Cloud native applications using open-source standards allow organizations to iterate and test new features frequently while ensuring compatibility and reducing vendor lock-in.
But challenges do exist. Cloud native applications emit a lot of observability data. A key benefit of edge computing is being able to reduce costs by limiting the transmission and centralized processing and storage of data. For organizations that want to centrally manage their software, how do they effectively monitor the health of these apps while they also control observability data transmission and storage costs?
What is edge computing?
Edge computing is an architecture that places compute and storage closer to the data collection site. Instead of transmitting data to a centralized processing location, the edge device processes all data on-premises. You can think of edge deployments as tiny data centers that have the capability to run independently of being connected to the cloud or a centralized data center.
There are lots of edge computing use cases. Sometimes, it’s an absolute requirement due to latency and connectivity considerations (think autonomous vehicles or robotic surgery). Other times, it can help reduce bandwidth and storage costs, improve security, meet local compliance requirements around data storage, or react quickly to a changing local environment.
Brick-and-mortar retail: Frontrunners of edge computing innovation
According to Accenture, “Edge is helping create new insights and experiences, enabled by the larger cloud backbone,” and predicts that “Edge technology will be a core retail capability.”
For several years, online-only retailers have had a big advantage — the ability to understand everything a customer does on their sites — every click, time spent looking at an item, or items added and removed from a shopping cart. This tracking data is a competitive advantage to improve how you search, navigate, checkout, and to provide instant offers. Have you ever received an email or text that offers 10% off the items you left in your cart?
With a retailer’s entire operations in the cloud, it is easier to collect and monitor the systems creating this data. Brick-and-mortar retailers increasingly use their physical stores as a competitive advantage to complement their online presence. More than three-quarters of retailers are focused on creating the same experience online and in-store according to a Global Data study.
In Accenture’s Store of Tomorrow blog post, they list several use cases retailers can consider today where edge computing plays a critical part when combined with other technologies like AI and ML. These include:
- Greater uptime and point of sale (POS) reliability
- Reduced inventory
- Enabled “walk out” checkout experiences
- Optimized inventory and use of space with smart shelves
- Personalized wayfinding to reduce wait times and understand foot traffic
Enter Kubernetes and cloud native
The lack of standards and integrated architectures are often cited as challenges for edge computing. There is still debate about some edge technology stack components, Kubernetes is solidly positioned as the recommended container management solution for emerging open-source frameworks, including LF Edge, EdgeX Foundry, and StarlingX.
A recent Cloud Native Computing Foundation report found that over 75% of respondents with edge applications use Kubernetes to automate, deploy, and scale containers
Kubernetes is used extensively in the cloud and at the edge running on server-class infrastructure (such as AWS Outpost or Google Thanos). To address the specific needs for edge use cases (ability to run Kubernetes on lightweight devices), there are several edge-specific Kubernetes distributions emerging, including K3s, KubeEdge, MicroK8s, and the recently announced Microsoft Azure Kubernetes Service (AKS) lite.
Several retailers are already taking advantage of these distributions, including Chick-Fil-A and Home Depot.
By extending Kubernetes to edge devices, organizations can use existing DevOps and cloud native practices to modernize edge applications and even move cloud-deployed workloads to the edge. The 2022 State of Edge report from the Linux Foundation refers to this practice as “born in the cloud, works at the edge.”
Challenges of cloud native observability at the edge
Monitoring large cloud native edge computing environments present several challenges, including:
Complexity
Cloud native edge computing environments are highly distributed and dynamic, which makes it difficult to understand and monitor the health and performance of every different component. As more edge devices are added and their capabilities increase, this becomes more difficult.
Cost
Cloud native environments create a lot of observability data — often 10x to 100x their virtual machine (VM) based counterparts. Controlling cardinality and overall data growth can be a challenge and leads to large increases in cost and unexpected budget overruns.
Scalability and reliability
As edge computing environments grow, it becomes increasingly difficult to scale monitoring and observability solutions to keep pace. As more devices are added, and more data is collected, the reliability of the observability system can become an issue.
When using Kubernetes at the edge, it is only natural to start using the open-source project Prometheus to monitor your environments. While this is a great starting point, maintaining and growing Prometheus monitoring infrastructure poses resource and scalability challenges as edge computing deployments increase.
Limited resources
Edge computing devices often have CPU, memory, and storage constraints, which pose a challenge in storing and querying observability data. New, lightweight Kubernetes distributions help address part of the problem. The Prometheus collector is lightweight, but the scalability issues can make using it difficult.
Chronosphere: Observability for cloud native and the edge
Chronosphere is an observability platform that enables modern observability, including edge computing use cases. Here’sChronosphere addresses the challenges associated with edge computing:
Complexity
To identify and remediate issues quickly, you need an observability solution that is fast and reliable, while delivering relevant findings to technical teams quickly. Chronosphere’s Control Plane ensures that queries and dashboards are fast and continuously optimized, so teams can identify, triage, and remediate issues quickly.
Cost
Costs increase as data volumes grow. However, you should not treat all data equally. With the Chronosphere Control Plane, you decide what data is kept, for how long, and at what resolution. It provides a suite of tools that allow you to analyze and shape your data to reduce cardinality and control long-term growth.
Scalability and reliability
Chronosphere has proven the ability to scale to tens of millions of active time series while maintaining industry-leading performance and availability. We also offer a 99.99% service-level agreement, but have historically delivered 99.99% to our customers.
Limited resources
The Chronosphere Collector requires minimal resources to run. It offers a number of deployment methods and does not need to run on the same hardware as the resources it monitors
The Collector is 100% compatible with Prometheus, so it works in any environment that exposes metrics with the Prometheus format, including any certified Kubernetes distribution. Since Chronosphere is a SaaS solution, additional edge resources are not required since all observability metrics are immediately sent to the cloud and processed centrally. Furthermore, the Chronosphere Collector uses compression — that we’ve observed reduces network costs by 66%.
How the Chronosphere Control Plane works
For edge computing, it is important to limit the data ingested and persisted. If bandwidth is an issue, you can simply drop metrics at the source. That isn’t a unique capability, as many observability solutions — including Prometheus and Chronosphere — can do that. However, this is a brute-force method that could result in useful data loss.
For most use cases, the issue of most concern is that persisted metrics aren’t useful and the ability to control metrics growth.. As the use of cloud native expands, system complexity will grow along with organizational complexity. Chronosphere is designed to address both while improving the speed at which you remediate issues.
Let’s start with the metrics growth issue. It’s known that similar-sized cloud native applications create much more observability data than their VM counterparts. There is a lot of data that isn’t useful, but how do you identify it? How do you know if a metric is used? Or how much is it used and by whom?
Analyze and understand
Chronosphere allows you to analyze your data volume (data points per second) and data usage (who is using the data, where, and for what purpose). The Metrics Usage Profiler identifies your least valuable and most valuable metrics and allows you to sort them based on utilization, utility, and ingest volumes.
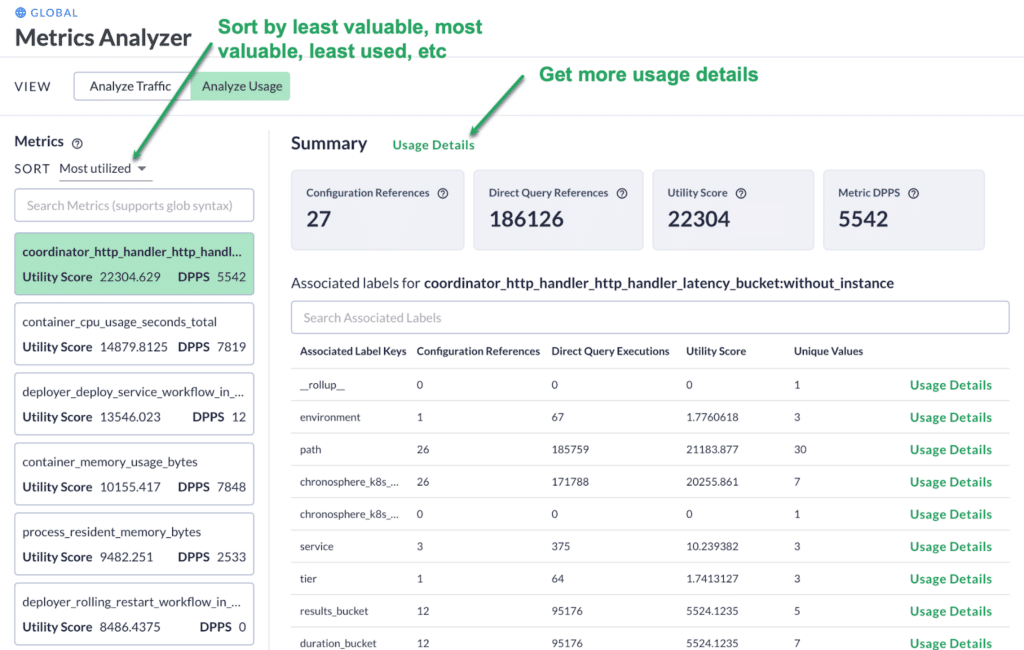
You can dive deeper to understand where it is being used — in dashboard and alerts — by whom, and how often.
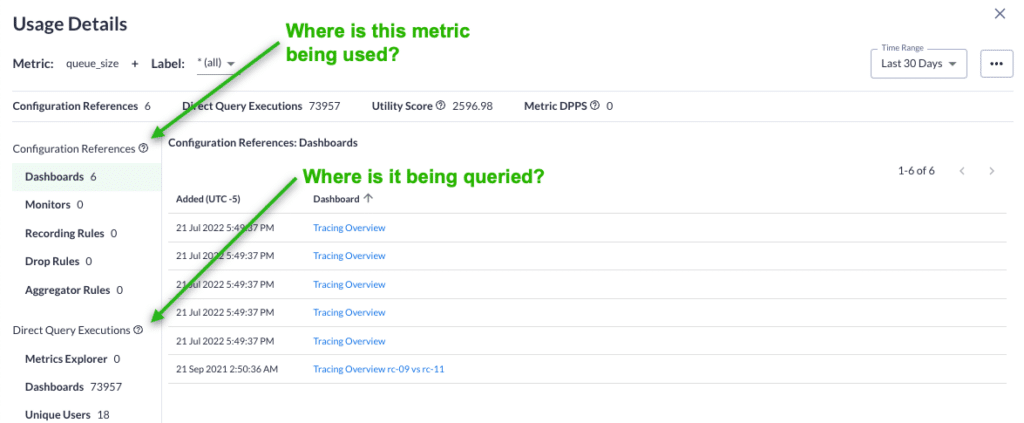
With Chronosphere’s tools, you can understand your data and make smart decisions about how to shape and transform it based on your business needs or how you want to use it.
Shape and transform
Chronosphere helps you dynamically shape and transform your data. The platform doesn’t require your developers to redeploy if you want to change your collected metric data. If you decide to stop collecting a metric or want to simply remove a metric’s label, you can do that.
Chronosphere charges based on what you store, not what you ingest. You can continue to ingest the metrics, but they won’t cost you anything, outside of consuming bandwidth. If you identify unused metrics, you can ignore them. If something changes and you need those metrics, then you can start to collect them again.
Perhaps there are used metrics, but you could optimize them to reduce the amount of stored data. You can reshape the data, and if you want, ignore the underlying metric data to reduce storage.
If you are a Prometheus user, you may think that Recording Rules can already do this function. Yes, they can do aggregations, but they do not allow you to ignore the raw data, which actually increases the amount of data you store. It is easier and more reliable to reshape data; doing so adds the ability to ignore the raw metric data to reduce storage volumes.
Delegate control
One of the biggest reasons metric volumes grow is that service owners/developers have limited insight into their metric usage. To address this, Chronosphere allows you to set up Quotas. You can carve up your licensed capacity and assign it based on service, team, or any other organizational construct you want.
Quotas ensure each group has a guaranteed persisted volume to use however they like. If a quota is exceeded and there isn’t excess license capacity, it will automatically drop metrics. Quotas automatically contain any cardinality spikes, ensure engineering teams don’t exceed their licensed amount, and means that other observability system users aren’t impacted.
Quotas delegate the responsibility of metric growth control to metric owners. By knowing how much they are allowed to consume and knowing which metrics contribute the most, teams can make decisions to optimize their data. This forcing function is important because it requires them to be smarter about what they store and start to consider the value of each metric.
Optimize
There are a lot of changes in cloud native environments. These changes can affect the overall performance of the system and impact query performance. To ensure queries stay performant, Chronosphere has a feature called Query Accelerator. It uses the platform’s shaping capabilities and automatically applies them to slow queries for optimization. Developers wasting cycles to optimize queries is a thing of the past.
Chronosphere also proactively identifies data that is completely unused — data that isn’t being queried, used in alerts, or used in dashboards. This is a powerful feature that removes a lot of manual work and helps you control costs and improve performance.
Conclusion
Edge computing helps organizations reduce network latency, trim data costs, and expand operational uses cases. But the technology also presents challenges around complexity, scalability, and data optimization. Chronosphere’s features – such as the Control Plane and Query Accelerator – helps edge computing users refine what data they store and avoid overages.
To learn more about Chronosphere’s features for edge computing use cases, please contact us for a demo.