In this blog about simulating monitors for more actionable alerts, you’ll learn about:
- Configuring alerts that consistently deliver value without creating unnecessary noise
- Having more complete visibility to drive their optimization efforts
- Making informed decisions about alerts based on real data
- Streamlining license management to maintain better control over observability costs
- Optimizing trace data with confidence
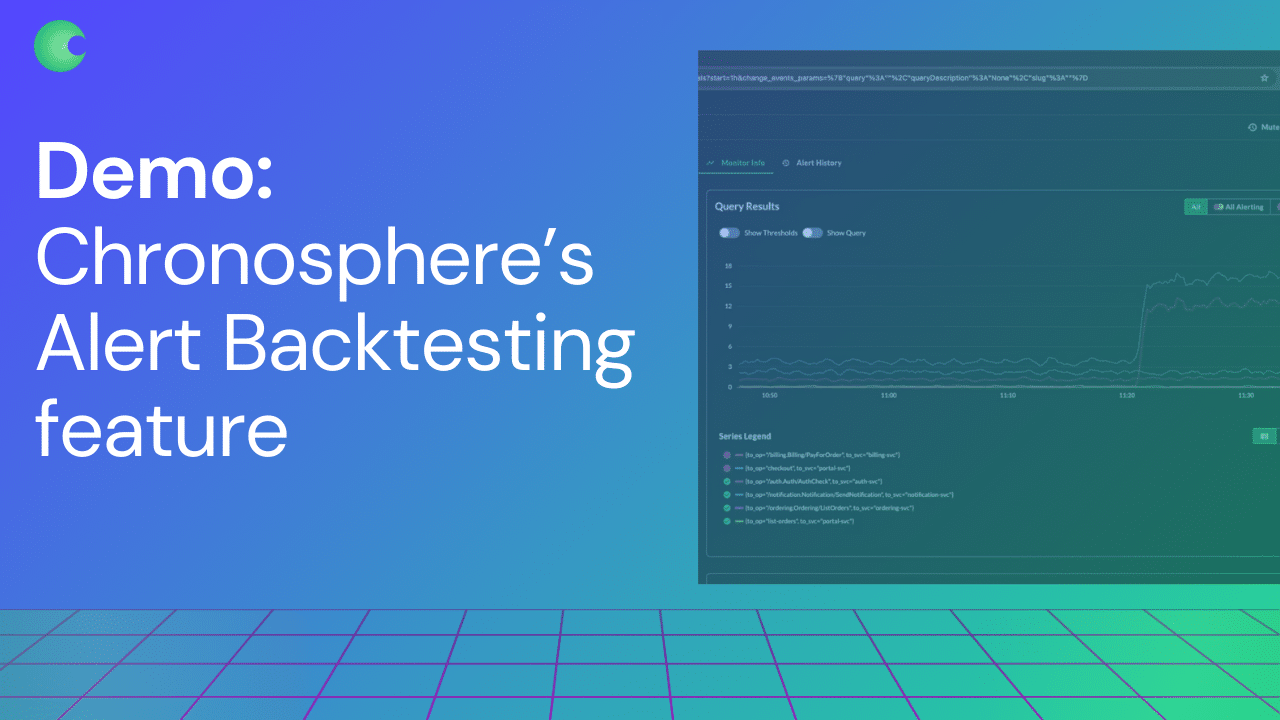
Take the guesswork out of alert creation with Alert Backtesting
Getting alerts “just right” has always been a delicate balancing act for observability teams. Too sensitive, and you’re drowning in false positives that create alert fatigue. Too conservative, and you risk missing critical issues that could impact your services.
Our new feature, Alert Backtesting enables teams to simulate their monitors against historical data before deployment, dramatically reducing the time and effort needed to create reliable, actionable alerts. This new capability addresses one of the most challenging aspects of observability: configuring alerts that consistently deliver value without creating unnecessary noise.
The challenge of alert configuration
Observability teams struggle with fundamental questions during the alert creation process:
- Will this alert catch real issues without triggering false positives?
- How will various conditions, like sustain windows and overrides, interact in practice?
These uncertainties often lead to a lengthy trial-and-error process, where teams must deploy alerts to production to understand their true behavior. This ultimately creates a “guess-and-check” workflow that can consume time and limit alert effectiveness.
Stay on top of “cardinality churn” with TopK Metrics in Persisted Cardinality
Recently, we announced the Persisted Cardinality feature, which allows customers to view their cardinality consumption broken down by pre-defined pools of their choice. This allows them to better attribute cardinality costs to specific teams or services.
Now, we’re adding TopK metrics to this view, helping users pinpoint areas of cardinality growth beyond the pools they’ve defined. TopK metrics helps teams proactively pinpoint sources of data growth by specific top metrics and label values. This is particularly helpful so teams can stay ahead of “cardinality churn” – or the rate of change in cardinality over time.
By combining these insights with our existing pool-based breakdowns, teams now have more complete visibility to drive their optimization efforts.
How Alert Backtesting helps
Alert Backtesting improves this process by allowing you to simulate alerts against real historical data – before deployment. Now you can:
- Visualize exactly when alerts would have fired based on past data
- Test different combinations of warning and critical thresholds
- Compare multiple alert configurations side-by-side
Chronosphere provides a visual overlay that clearly shows sustain and resolve windows, with precise markers indicating when and how long alerts would have triggered. This visual feedback makes it immediately apparent how different “knobs” – like query adjustments and threshold changes – affect alert behavior.
With Alert Backtesting, teams can now make informed decisions about alerts based on real data to:
- Reduce alert fatigue by catching over-sensitive configurations before they impact teams
- Minimize blind spots by validating alert coverage against known past incidents
- Save engineering time previously spent tuning alerts through trial and error
What else is new?
Understand consumption versus budget from a single view with License Overview
Managing observability costs effectively requires clear visibility into usage patterns and trends across all telemetry types. Our new License Overview page gives administrators a comprehensive, unified view of their observability consumption against allocated budgets.
This centralized dashboard enables teams to:
- Monitor real-time consumption across different telemetry types against established budgets
- Analyze historical consumption trends to identify patterns and anomalies
- Access detailed drill-down pages for deeper analysis on relevant license dimensions
By consolidating this critical information into a single view, administrators can now make more informed decisions about resource allocation and quickly identify areas where optimization might be needed.
This streamlined approach to license management helps teams maintain better control over their observability costs while ensuring they’re getting maximum value from Chronosphere.
Test behavior-based sampling strategies with Behavior Preview
Making changes to trace sampling in production can be risky – you might not fully understand how different sampling rates affect both data quality. Our new Behavior Preview capability eliminates this uncertainty by allowing teams to validate sampling strategies before implementation.
Behavior Preview builds upon our existing Behavior-based sampling feature, enabling users to:
- Simulate the impact of sampling changes on trace data volumes
- Compare multiple sampling strategies side-by-side
- Deploy successful preview configurations directly to production
This preview functionality appears in the dataset page alongside active behaviors, making it simple to test and validate sampling changes. Teams can either run the preview for the full 7-day period to understand long-term impacts, or promote effective configurations to production as soon as they’re confident in the results.
By removing the guesswork from sampling configuration, Behavior Preview helps teams optimize their trace data with confidence.
Conclusion
As we continue enhancing the Chronosphere platform, our focus remains on making observability more actionable, predictable, and cost-effective. These updates help teams maximize the value of their observability data while maintaining operational efficiency. Stay tuned for more improvements next month!