")

Why use a Telemetry Pipeline?
Telemetry Pipelines are a tool for collecting, processing, and routing data to multiple destinations. Within this operational guide we explore how users should prepare, plan, and execute on deploying a Telemetry Pipeline within their organization. This operational guide runs through use cases, deployment and infrastructure, as well as general architecture
One of the biggest questions is whether a telemetry pipeline is suitable for your use case or organization. In the same way deploying a full container orchestration system like Kubernetes might be overkill for running a single containerized workload, deploying telemetry pipelines can also be overkill for certain use cases.
For example, routing data from source A to destination B could be done with a Telemetry Pipeline. However, if you have constraints on resource usage, or are performing no processing, using an open source agent like Fluent Bit may be more suitable.
Telemetry pipeline use cases
So where does a telemetry pipeline have the highest impact? Let’s look at some of the following use cases and benefits:
With these use cases it may seem like a simple opt-in to enable a telemetry pipeline, especially when sending data from point A to point B. However, like most components, there are many thoughts and considerations when looking at how to deploy, manage, and operate a Telemetry Pipeline within your environment.
This is where Chronosphere’s Fluent Bit-based Telemetry Pipeline comes in. From the creators of Fluent Bit, Chronosphere Telemetry Pipeline streamlines log collection, aggregation, transformation, and routing from any source to any destination.
Chronosphere Telemetry Pipeline introduction
With Chronosphere Telemetry Pipelines (CTP) we built a system with the following core principles:
- Cloud / Kubernetes native architecture
- Separation of processing (data plane) and management (management plane)
- Highly performant to maximize scale
In the following operational guide we go through how to implement Chronosphere Telemetry Pipeline to achieve these core principles and unlock the use cases listed above. Additionally, we discuss how Day 2 operations are streamlined with the feature set.
Chronosphere Telemetry Pipeline architecture
The Chronosphere Telemetry Pipeline is made of two major components: The management plane that is owned and operated by the Chronosphere team and the data plane that is deployed within your environment, close to where data is being generated.
This architecture style, known as either hybrid and/or Bring Your Own Cloud (BYOC), also uses a single outbound connection between the management plane and data planes.
This architecture ensures that data is fully processed within the data plane and does not go to the management plane, while the management plane purely stores configuration and observability data.
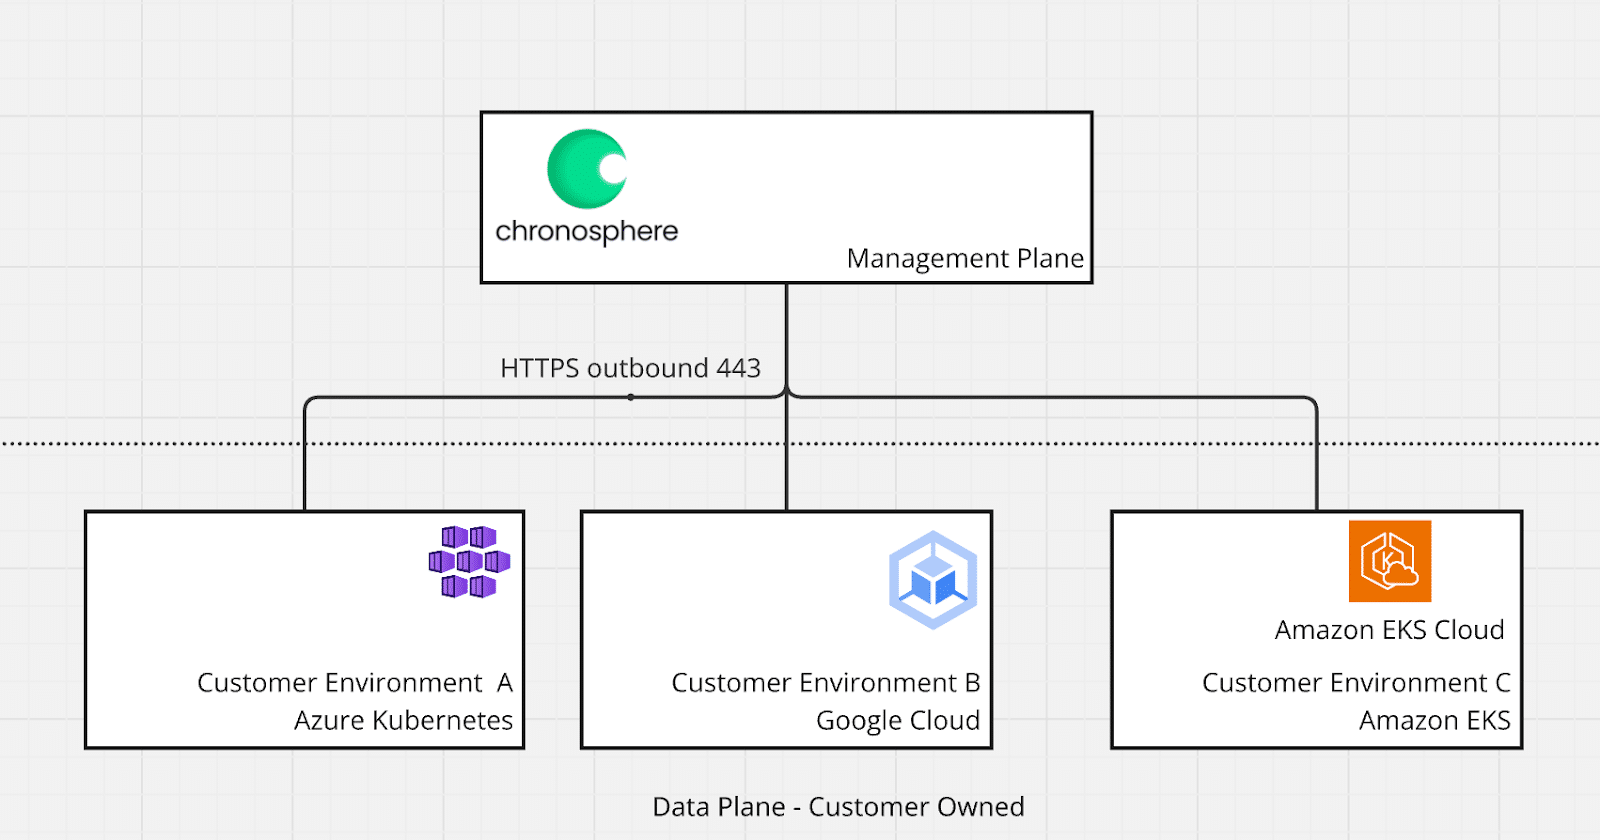
The management plane is also able to manage multiple data planes which can be deployed across multiple clouds, environments such as on premises, public / private cloud, as well as different base infrastructure setups like Kubernetes and Linux servers.
A full list of environments are shown below
This architecture promotes deploying data planes as close to the data source as possible, which also assists with egress charges from public clouds or bandwidth limitations from private and on premises clouds.
Getting started
When you sign up for Chronosphere Telemetry Pipeline you are automatically granted access to your own Project named “default.” Projects are groupings that provide administrators and other users with access to the project. These users are then able to onboard, control, and deploy data planes and pipelines.
These projects can have many members with role based access controls (RBAC) which are noted below
There are no limits to how many projects you can have access to though we recommend the following division for projects
Supported login providers
Chronosphere Telemetry Pipeline supports SAML / SSO for login. The following list of providers are supported:
- SAML 2.0
- Okta Workspace
Please contact your Chronosphere account representative to set this up.
Data plane components
As seen above, the Telemetry Pipeline’s data plane is the primary place where data is received, processed, and routed. The components that make up the Telemetry Pipeline Data Plane are spelled out in the chart below. You can find a full list of these components and concepts within the documentation.
Planning a deployment
Once you have set up the management plane of the Telemetry Pipeline with proper users, projects, and permissions we will move to the deployment of the data plane in your environment. There are many considerations such as sizing, networking, and future scaling that we will also want to take into account.
Deploying a data plane
When planning where to deploy the data plane we want to answer the following:
- Where is the data that I want to collect being generated? Is it on-premise or in the cloud ?
- How will I retrieve the data? Do I need to install an agent and push data to the pipeline or will I pull that data via S3 storage, HTTP API scrape, or Kafka protocol.
- What type of processing do I need on top of that data? Will I need 5 actions, 10 actions, or hundreds?
- How many pipelines will I have? 1 per data source, or 1 general pipeline?
These questions should inform where you may want to deploy the data plane relative to where the data is being generated. Costs, external to the pipeline, that you should take into account are:
Infrastructure recommendations
When deploying on top of public cloud providers you can leverage a varying set of components that can meet the above sizing guidelines. However if you are creating brand new infrastructure for the Telemetry Pipeline we recommend the following instance types:
Sizing for pipelines
Within a data plane users can operate multiple pipelines that receive data from different sources and route to different destinations. As part of this deployment, every pipeline has an individual lifecycle that can perform and report on the following:
- Auto-load balancing across replicas
- Auto-healing
- Auto-monitoring to show you performance of input and outputs
- Configurable auto-scaling
- Configurable resource profiles for CPU / memory usage
Because Chronosphere Telemetry Pipeline is based on Fluent Bit, which is already a high performance application written in C, sizing is advantageous when comparing with other pipeline solutions or streaming architectures.
This architecture also grants high amounts of benefits when routing to multiple locations as Chronosphere Telemetry Pipeline can route to multiple locations without having to copy an entire data stream.
Another benefit Chronosphere Telemetry Pipelines offers — each pipeline has a unique lifecycle and Chronosphere supports different sizing per pipeline. For example you can have a syslog pipeline handling TBs of traffic a day with multiple replicas across 3 availability zones in a public cloud. Meanwhile, a pull-based pipeline could have a single pipeline with smaller size.
When using a Virtual Machine deployment, as we also deploy K3s we would also recommend additional padding to ensure that the orchestration system can also run without hiccups.
While these guidelines work for most use cases another method of sizing is also looking at what settings impact what type of usage.
Scaling
The primary way that pipelines are scaled is via Replicas.
A replica is a single process of the Telemetry Pipeline that receives, processes, and sends the data. They are similar to ReplicaSets within Kubernetes where you may have multiple pods performing the same actions for scale or high availability purposes.
Increasing the number of replicas adds another processor that can receive or pull logs depending on the type of source. A few important notes when planning a pipeline for scale
These are dependent the push- or pull-based cases from above:
- Replicas can be increased manually or based on auto-scaling
- Push-based replicas require no additional configuration with automatic load balancing
- Pull-based replicas can require additional configuration depending on the input / source
- EventHub, Kafka, Confluent inputs within pull-based use cases require setting group.id configuration to ensure no duplication of data
- S3+SQS inputs does not require additional settings
- HTTP API Scraper inputs we recommend only one pipeline
Auto-scaling
Auto-scaling based on Horizontal Pod Autoscaler within Kubernetes is primarily built for push-based sources of data. This scaling works by scaling on compute or memory, generally memory is the primary method on which you will want to scale pipelines
Additionally, overprovisioning replicas that are part of a push-based pipeline is not too worrisome given the low amount of resources required: generally 15-20mCPU and 40MB of RAM per replica.
Networking
One of the more difficult parts of planning a pipeline deployment is networking requirements with external dependencies. In general, we need the following questions answered:
Load balancers
Pipelines that are configured with receiver sources (e.g., TCP, HTTP, OTEL) automatically load balance across all configured replicas. You can increase the number of replicas and all traffic is automatically load balanced.
Load balancing is automatically round-robin, however you can also set weights when using an external or custom load balancer.
Within a Kubernetes deployment, pipelines can also manually provision an external load balancer on your behalf depending on the LoadBalancer default resource you have configured within the cluster. For example, on AWS an external facing Elastic Load Balancer (ELB) can be automatically configured.
If you already have an external load balancer you can choose to do one of the following
- Point the Load Balancer directly to the service endpoint within the Kubernetes cluster
- Point the Load Balancer to all the NodePorts exposed within the Kubernetes cluster
TLS and Certificates
Pipelines with incoming traffic support TLS termination at the pipeline level however this does add additional compute resources on the pipeline. Depending on the above load balancer deployment you may also choose to terminate TLS at the load balancer level or within a service mesh.
Buyer’s Guide: Telemetry Pipelines
Build a smarter telemetry pipeline. Download The Buyer’s Guide to Telemetry Pipelines
Importance of high availability
Similar to networking settings, high availability is one of the highly important aspects to plan for when the Telemetry Pipeline sits in between your observability data generation and analysis. As a general note, all Pipelines configured with Chronosphere Telemetry Pipeline:
- Automatically re-deploy a replica (auto-heal) when there are out of memory events or crashes within the pipeline
- Re-distribute pipelines when re-creating depending on node availability
- Perform rolling updates when modifying configurations to ensure minimum disruption on updates
- Pull-based pipelines have the ability to recover on failure based where they last read data (checkpointing)
In addition to these automatic settings you should also ensure that pipelines are configured with extra replicas to have processes that are always performing processing.
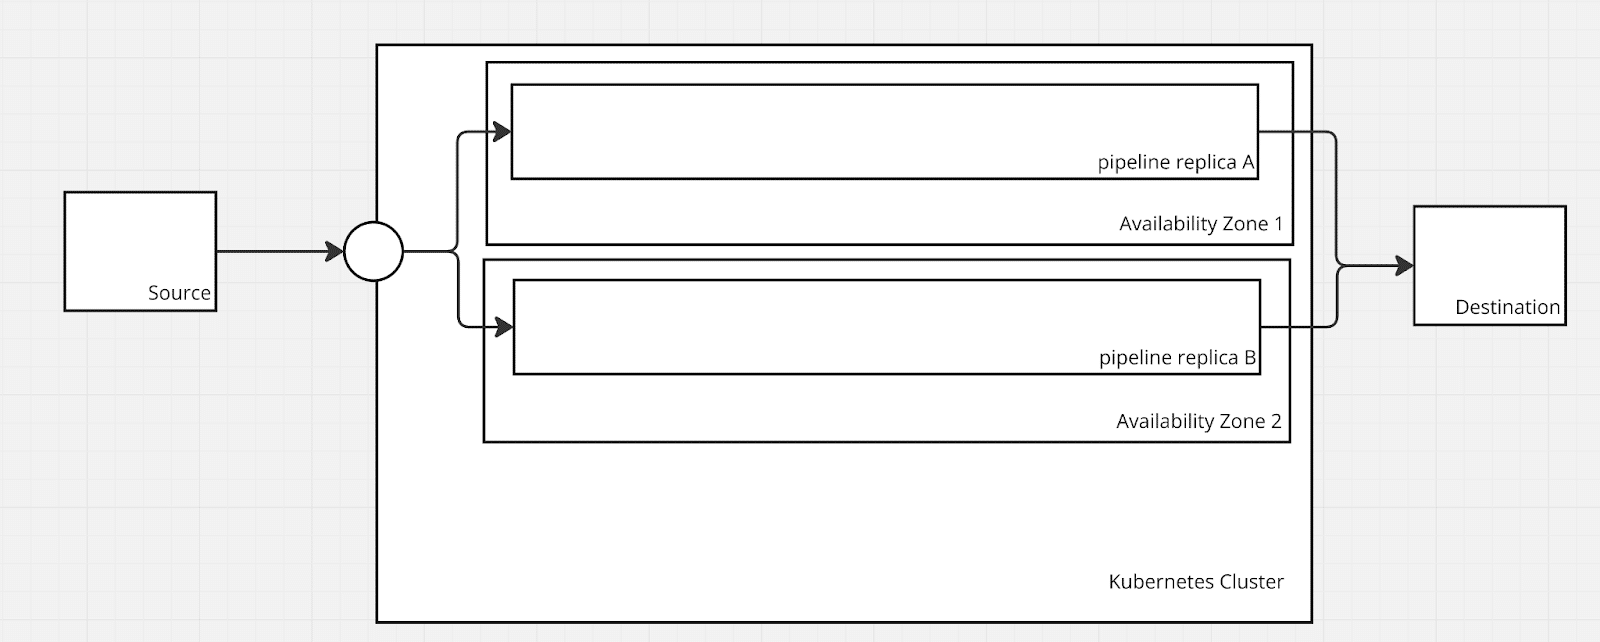
Cross availability zone deployment
When deployed in Kubernetes, a common way to ensure that your pipeline is highly available is to make use of cloud availability zones or separate data centers within a single cloud region. If your Kubernetes deployment is already deployed across availability zones, you can make use of Tolerations and Taints within your pipeline to disperse across them.
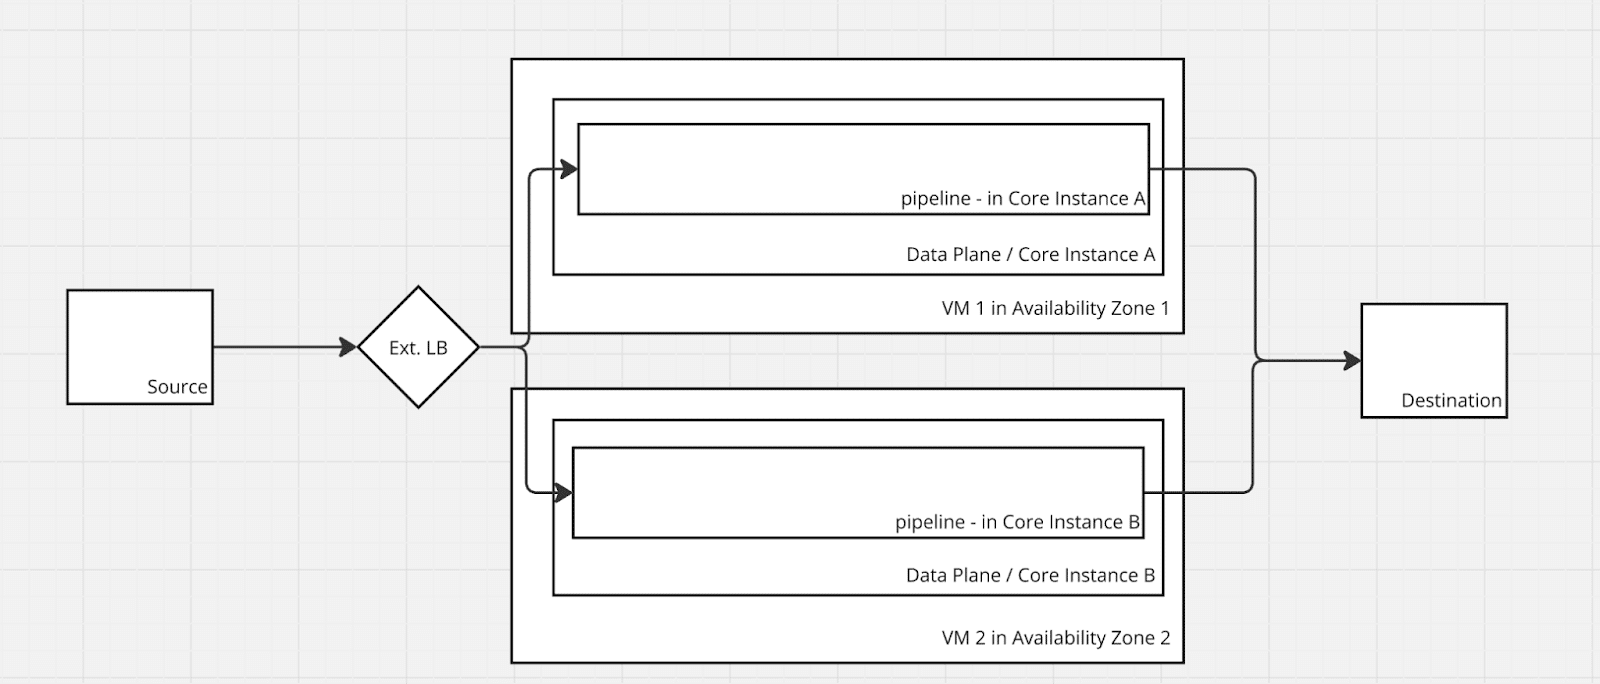
Virtual Machine (VM) deployment and high availability
Similar to a Kubernetes deployment you can make use of some of the automatic operations and cloud high availability options to help maintain highly available pipelines. The general concept of multiple replicas stays true with the addition of pipelines needing to be replicated across multiple data planes.
Active-active with external load balancer
External load balancers can balance traffic between two pipelines on two different Virtual Machines which can be used to achieve a similar effect to the Kubernetes Load Balancer. There are some additional operational burdens when deploying by making sure that each “active” pipeline is configured the same in each core instance.
Error handling and backpressure
While High availability is required to ensure the maximum uptime of the Telemetry Pipeline we also want to ensure that we have adequate Error handling in place as well as backpressure enabled for buffering and routing.
Retry and exponential backoff
A retry is a setting that allows the Pipeline to send data again at a set interval for a set amount of times.
Retries are configured per output with an automatic setting of 1 retry. As all data going through a replica is automatically batched into 2MB chunks, each retry is applicable to each of these chunks or batches of data. For extremely important sources and destinations you can set custom retry configurations, such as infinite to ensure that data will continue to send even in the case of a backend disruption
Retry scheduling is also another setting that can be configured with the default being based on an exponential backoff system. In some cases you may wish to have a maximum wait time to ensure even in an exponential backoff scenario you are not waiting 30 minutes or more for data to flow to the endpoint.
Buffering
Pipelines include four types of buffering:
- Memory Only
- Memory + Storage
- Memory (Ring Buffer)
- Memory + Storage w/ Ring Buffer
The default configuration is a memory only buffer with the amount of memory based on the resource profile set per replica. However using storage can limit the amount of memory that is required while using disk buffers within each replica
In the case of a memory only buffer being overwhelmed, backpressure can cause events being sent to the pipeline to fail. This would require downstream agents sending data to also have buffering which can be problematic when using external agents that you may not control
Alternatively you can use a ring buffer that in the case of a down backend will continue to drop the oldest batch of data available to ensure no pauses to incoming data. This is particularly useful for network data over UDP that is often not able to retry upon failed connections.
Lastly, another strategy is to use in-built monitoring to identify high amounts of retry and failure and swap the output to a different destination such as Amazon S3 or other block storage. Upon recovery you can re-ingest that data into the original destination.
Checkpointing
With pull based plugins the Telemetry Pipeline can make use of checkpointing to understand where the last set of data was pulled from. This is dependent on the plugin however the following general rules apply:
1: HTTP API Scraper
The checkpoint for the last scraped data is stored in the management plane which can help resume in case of pipeline failure or infrastructure failure. This is also applicable to all plugins built on top of this particular plugin (E.g. Okta, Microsoft intune, etc.)
2: S3 + SQS
As the last pulled data is dependent on the SQS queue that is configured, if there is a failure the pipeline can recover from the last event pulled. Important note is that if you have multiple data sources pulling from S3 + SQS you need to be cognizant of whether any of the sources are deleting messages upon SQS read.
3: Kafka based (Azure EventHub and Confluent Cloud)
Kafka based plugins make use of the group.id setting to coordinate incoming data and checkpointing is done server side to understand the last message acknowledged. You can also set a custom offset if you want to replay specific data or messages are missing.
Installing in existing Kubernetes deployments
All Chronosphere Telemetry Pipeline Data Plane deployments whether they are on Kubernetes or virtual machines make use of Kubernetes orchestration. However when using an existing Kubernetes cluster there are additional considerations around namespace and adhering to existing cluster policies.
Stay tuned to this space where I’ll be writing more about telemetry pipelines and all things Fluent Bit. Next up: A Fluentd to Fluent Bit migration guide!
Buyer’s Guide: Telemetry Pipelines
Build a smarter telemetry pipeline. Download The Buyer’s Guide to Telemetry Pipelines