")


The rise in cloud native environments has offered organizations key benefits like agility and speed. However, while a modern architecture can support a competitive edge, it also introduces a unique complexity that often challenges developers, even during straightforward tasks. That’s why, whether it’s managing data, time, or spend, it’s more important than ever for teams to find ways to be more efficient.
What happens when engineering teams try to avoid pesky complexity with well-intentioned technical decisions that instead prove counterproductive? While these decisions are made because they seem trouble-free and easy, they actually pack a hidden list of consequences, including wasted engineering time and resources.
In a previous blog, we identified key observability best practices teams can use to make the most out of their cloud native systems. Now, let’s examine the flipside of best practices and look at observability anti-patterns: technical decisions that may seem to provide assistance but ultimately backfire and introduce a new set of issues – impacting developer efficiency.
In this blog, we discuss three common observability anti-patterns and ways that your team can solve them, and real-life horror story examples:
- Runaway metrics cardinality
- Relying on out-of-the-box templates
- Treating data as a free-for-all
Real life example of an anti-pattern
Let’s look at an example of a real-life anti-pattern: You want to make yourself some breakfast, but you’re in a time crunch with a lengthy Zoom meeting coming up. You decide to grab breakfast patties from the freezer, but they’re frozen to the core.
Here’s what you can do in this situation:
- Run the frozen food under some hot water and let it fully thaw, even if that means waiting to eat.
- Pop the food into the microwave on high, hope for the best, and then cook the patties.
Let’s say you go with option B, since you’re hungry and don’t have much time. So, you microwave and cook the patties quickly. But when you go in to take a bite, you realize that, while the outside looks relatively done, it’s still completely frozen on the inside!
Now, your patties are covered in toppings and you’re unable to reheat them – deeming them inedible. You just wasted a patty, the money you spent on it, and your own time.
The impact of runaway metrics cardinality
Metrics are helpful for teams to identify and remediate issues before they impact the customer. However, when engineers increase metric cardinality in an effort to gain better data context, they could end up spending more time in the future sifting through a sea of data that isn’t actually relevant. Let’s take a look at an example of runaway metrics cardinality and how this becomes an observability anti-pattern.
“When we talk about metric cardinality, we mean the number of unique time series that are produced by a combination of metric names and their associated labels [dimensions]. ”
Scenario: Adding labels to metrics
One way that engineers may inadvertently increase metrics cardinality, impacting developer efficiency, is by adding too many labels to their metrics.
Here’s an example: If a request was made from a mobile phone to load the home page of an app, that would be one, singular request. But, let’s say the team over at that app wants to know what locations the majority of people are requesting from, so they add a dimension for ZIP code to every request metric. There are 41,683 unique ZIP codes in the U.S. All of the sudden, that one metric has gained all of this metadata – bits and bytes that are in need of storage.
This is where teams would run into two major problems:
- Time waste: With the growing number of dimensions on a metric, query time lengthens.
- Cost waste: Because many observability tools charge based on the number of dimensions, costs to store the metrics skyrocket.
While adding additional labels to metrics may seem like a quick way to understand your systems or customers, if teams aren’t careful, the volume can easily get out of hand. As our CTO notes, adding too many labels or the wrong label (such as requestID) can greatly increase the number of series that you end up tracking.
In a worst case scenario, you could end up with a new series for every request your application handles. This decision is incredibly expensive, and, not to mention, defeats the purpose of using metrics in the first place.
Solution: Tame cardinality rather than avoid it
Teams shouldn’t completely avoid cardinality, but rather work with it! Although cardinality can bring storage and cost challenges, the right cardinality can provide vital context around data and triaging efforts, before issues become a customer-facing observability anti-pattern.
For example, teams can extract true value out of their cardinality by sorting and categorizing their data by dimensions that the business would care about, to find out more on:
- What is going wrong
- What groups are affected and experiencing issues
Chronosphere’s Telemetry Usage Analyzer
Chronosphere’s Telemetry Usage Analyzer offers usage details that sort metrics from most-to-least valuable and most-to-least utilized. With this information, teams can:
- Analyze cardinality
- See how often it is being used, and what dimensions are used
- Make the right decision on whether or not it should be deleted
Without intentionally creating that level of visibility, cardinality can be intimidating. Using the power of Chronosphere’s Telemetry Usage Analyzer, teams can take action to understand which cardinality is helping engineers understand their system, and what they can chisel away at to save on costs.
Don’t let out-of-the-box-templates become your nemesis
A second common observability anti-pattern is the over-reliance of out-of-the-box dashboarding templates. While these templates are an easy foundation and great starting point for gathering preliminary information around their data, it doesn’t necessarily provide deeper context on issues. This is because out-of-the-box templates only provide information around the general health of your system; if something is going wrong, not where or why.
Here are two major anti-patterns teams could run into when using on out-of-the-box templates:
-
Dashboard confusion
By default, out-of-the-box templates use metric names such as: “MySQL number of connections.” By relying on vague names and titles, teams will likely end up confused by lack of context.
One way to mitigate this anti-pattern is by changing your dashboard titles to specify the database type, or add a note that lets others know the validity of the database: Is this a database that stores user information or e-commerce orders? Knowing the purpose of the database helps engineers quickly assess what part of the customer experience is impacted.
-
Business context
Out-of-the-box templates are very similar to a “one-size-fits-all” method. By simply relying on copy and paste-able dashboards, you aren’t exploring what the metrics are for. This makes it difficult to get a sense of what is in the dashboard, and what it means for the business. For instance, if the data in the chart becomes unruly and you receive alerts on your database, you’ll be left flying blind wondering what the customer impact is.
Solution: Adapt your dashboards and get to know your data
It’s easy to fall into the anti-pattern of relying on out-of-the-box dashboards because they are digestible and easy to view. However, these templates should be treated as a starting point rather than an ending point to understanding your data.
Out-of-the-box dashboards aren’t an excuse to not understand your data. Have you explored the data? Do you know what it means and if you actually need to be sending it? It’s important to take steps to adapt your dashboards, so that anyone peeking into the dashboard charts can understand what data they are looking at, and why it’s important.
Migrating vendors and Chronosphere
When organizations move off of one vendor, and migrate onto another, they could risk losing all of the information in their out-of-the-box dashboards. Considering a solution that is open-source compatible is key, so that teams can take their current dashboards and templates with them wherever they go.
Chronosphere is fully open source compatible, from ingest of data (Prometheus and Open Telemetry) to visualization. That means that customers can import dashboards from OSS projects like Grafana, or the Apache-2.0 alternative Perses (part of the CNCF) to Chronosphere with a simple copy and paste. Our technology also offers analytics that show your query usage and insight into how your team uses Chronosphere’s platform. This ensures teams that they are getting the value they expect from the dashboards they bring with them, and better understand its level of utility.
Treating data as a free-for-all? Think again.
The last common observability anti-pattern that can cause engineers future trouble is collecting any and all observability data they can possibly imagine – a decision which drastically increases cloud bills and makes it harder to quickly find useful data when you need it. Born out of an organizational issue across both the engineering team and beyond, it’s easy to use data as a free-for-all (especially when there is so much of it and rarely any accountability!) and throw whatever you please into the mix. Engineers might do this with good intentions. But, without additional needed visibility into that pile of data, costs can quickly skyrocket and get out of hand.
Solution: Set guardrails and continuously monitor cost with a FinOps practice
FinOps is the birth of the finance and engineering relationship — where the two departments come together to drive accountability, optimize and monitor cost in unison. Accountability is something that is often lacking in observability solutions, meaning that engineers have no incentive to consume less observability data.
With Chronosphere Quotas, you can allocate specific portions of your license to teams and let them determine how they want to use the capacity. Along with Quotas, it’s critical to give teams transparency into what data they are generating and how their traffic shape changes over time, empowering them to make changes where and when they need to.
How Chronosphere provides the antidote to anti-patterns
Observability anti-patterns are common, especially in today’s fast-paced, data-driven world. And while they emerge from well-intentioned engineering decisions, when left unchecked, they can become detrimental to developer productivity and therefore your business. That’s why, reducing burden and promoting sustainable practices across your teams is key.
Below, we dive into how Chronosphere’s Observability Data Optimization Cycle helps treat and prevent harmful observability anti-patterns, all while supporting cost control and productivity.
Chronosphere’s Observability Data Optimization Cycle
Chronosphere recently introduced the Observability Data Optimization Cycle, a framework designed to deliver the best possible observability outcomes at scale – so that teams don’t have to fall into pesky anti-pattern traps and can be supported everyday with the way they need and want to work.
The Observability Data Optimization Cycle begins with a foundation of centralized governance, followed by three steps: analyze, refine, and operate (hear Chronauts discuss the full data optimization cycle in this debut episode of our video series, Chronologues!)
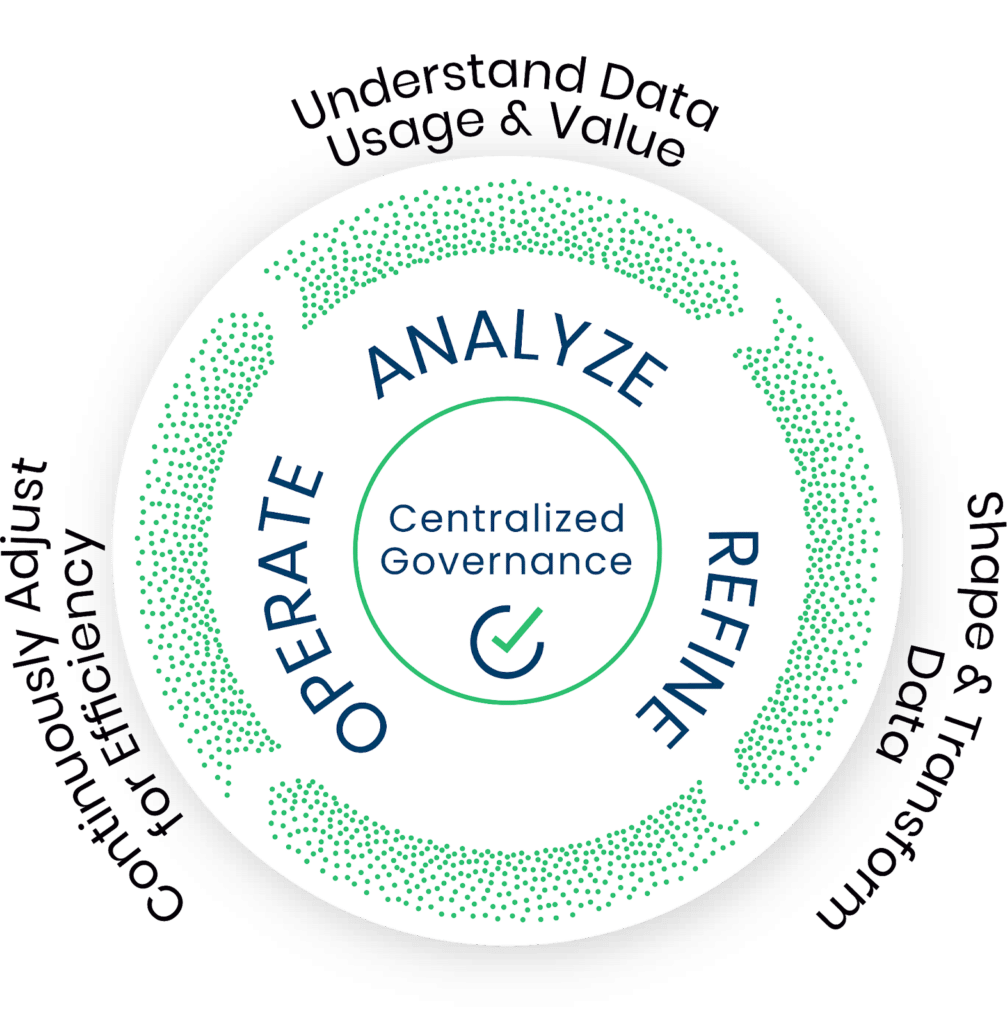
Step 0: Centralized governance
With centralized governance, teams are supported to protect themselves against cardinality spikes and budget overruns. Specifically, quotas ensure that each team and service prioritizes their metrics based on the value that they deliver.
Step 1: Analyze
Chronosphere’s Traffic Analyzer allows teams to see incoming metrics in real-time, grouped by label, alongside their relative frequency. With this feature, teams can see which metrics have the highest ingest rate, as well as the cardinality of the associated labels.
As mentioned previously, Chronosphere’s Telemetry Usage Analyzer provides a view into cost versus utility of each metric. The utility score shows where that metric is used, how often, and by whom — to help teams make better shaping decisions.
Step 2: Refine
With this step in the Observability Data Optimization Cycle, engineering teams can shape and transform data to improve performance. With the ability to shape data dynamically, engineers can adjust shaping policies on the fly, so that application redeployment isn’t needed.
Step 3: Operate
In the last step of the cycle, engineers are supported to optimize data for efficiency – and ensure that dashboards, alerts and queries are fast and able to deliver critical information to your team.
Learn more about Chronosphere’s solutions
In a cloud native world full of data and noisy neighbors, Chronosphere supports engineers to find peace of mind without relying on processes that could eventually become observability anti-patterns, knowing that they have relevant insights when they need them and full control over their system.
Additional resources
Curious about Chronosphere and how we can address anti-patterns and promote developer productivity? Check out these resources below:
- Understanding metrics quotas and pools
- 5 tips to improve developer productivity for cloud native environments
- Live Telemetry Analyzer


