Control Plane
Now with Control for Logs
Focus on the data and insights that matter. Chronosphere helps you control metrics, log, and trace volumes without touching source code or redeploying services.
Reduce Cost and Data Volume
Average ROI
Containerized workloads generate 10-100x more data than traditional VMs, inflating costs. Chronosphere helps you maximize ROI while maintaining the visibility you need.
Average Data Volume Reduction
Transform your observability practice from a cost center to a competitive advantage. Chronosphere gets data growth under control.

How It Works
The Control Plane helps you reduce observability data volume, and cost, to improve performance and deliver more business value.
It’s built upon a framework required for success that we developed while working with leading cloud native companies. We call it the Observability Data Optimization Cycle.
Key Benefits
Reduce observability data volumes by 89%
- Easily identify and eliminate data that isn’t used and doesn’t deliver value
- Reduce metrics, trace, and log data while preserving its analytical value
Keep cost predictable and manageable, even as you scale
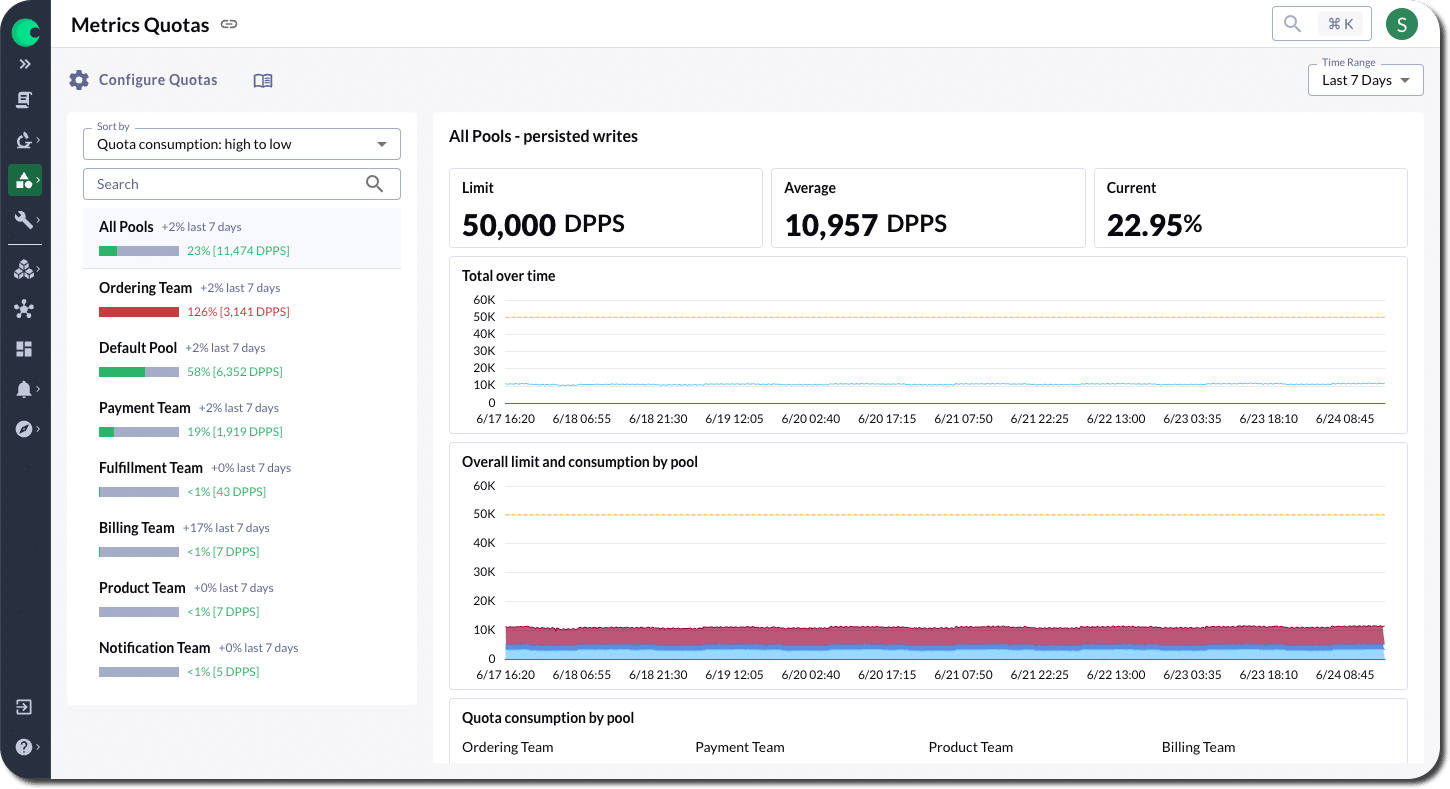
- Control cardinality and volume spikes. Prevent teams from over-consuming their capacity by assigning Quotas
- Give each team the autonomy to manage their allocation
- Chronosphere delivers intuitive controls that provide real-time visibility into consumption
Reduce time spent troubleshooting by 50%
- With data continuously optimized, engineers can find the data they need to solve problems faster
- Amplify underutilized high-value data to ensure the entire organization has access to it
Features
Centralized Governance
Allocate capacity based on business priorities with Quotas
- Assign capacity by team or service to protect against cardinality or log volume spikes
- Prioritize metrics and log data based on the value they deliver
- Empower each team to manage their budget allocation
Analyze
Understand the usage and value of your observability data
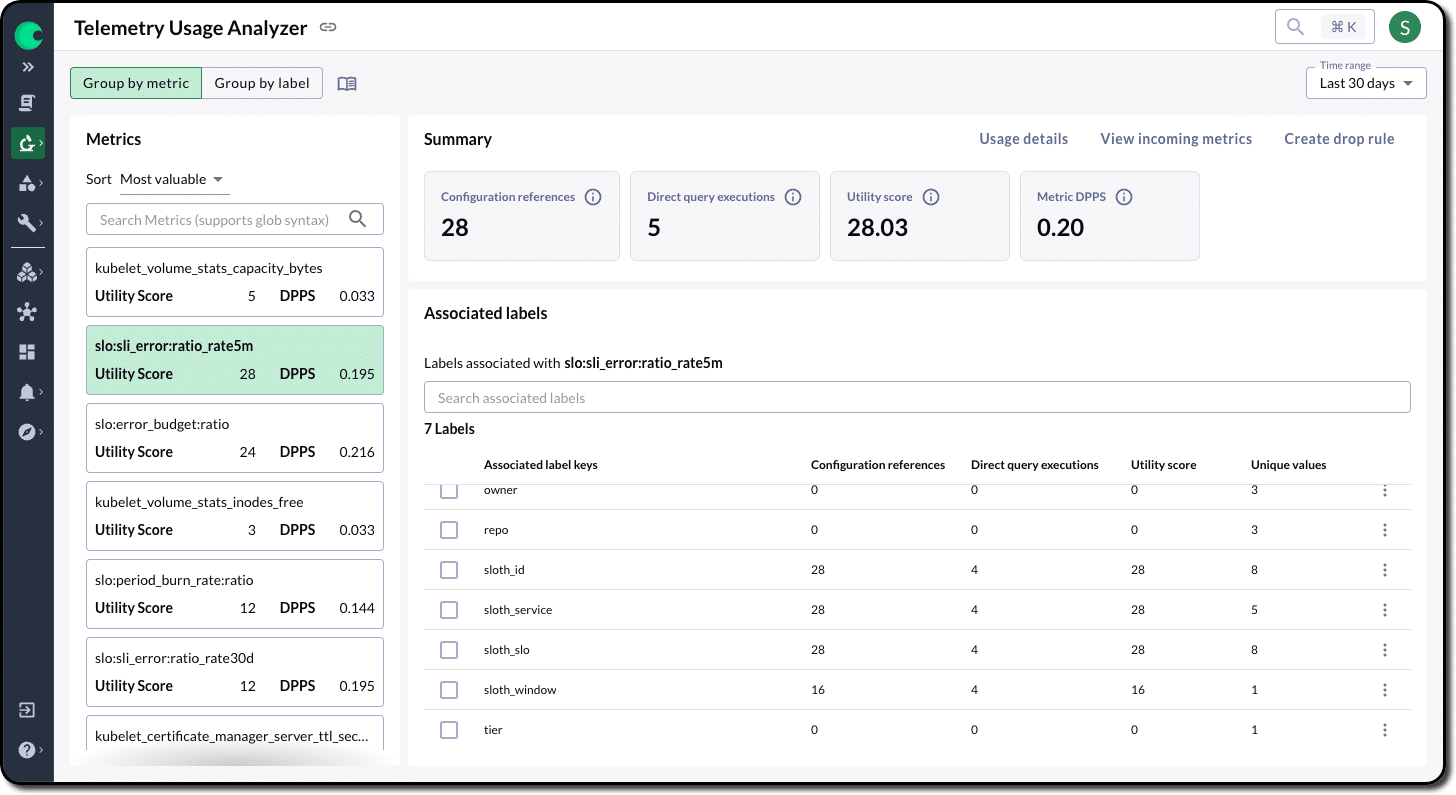
- Automatically assign a utility score to all incoming logs and metrics, based on where the data is used, how often, and by whom
- Spot costly metrics in real time. Identify high cardinality metrics and see how its labels contribute to costs
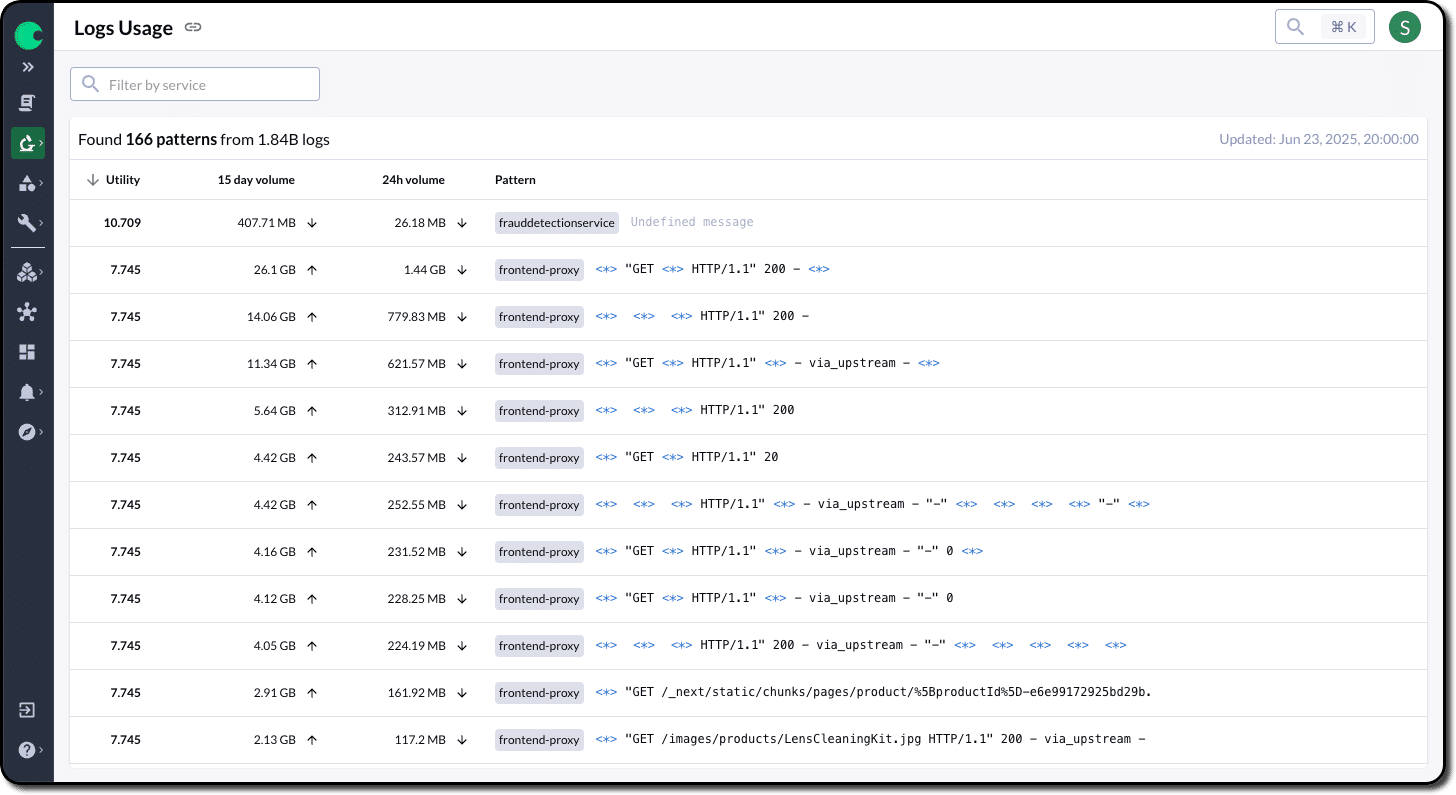
- Track log volume growth proactively. Anticipate increases and find optimization opportunities
Refine
Shape, transform, and reduce data to control costs and improve performance
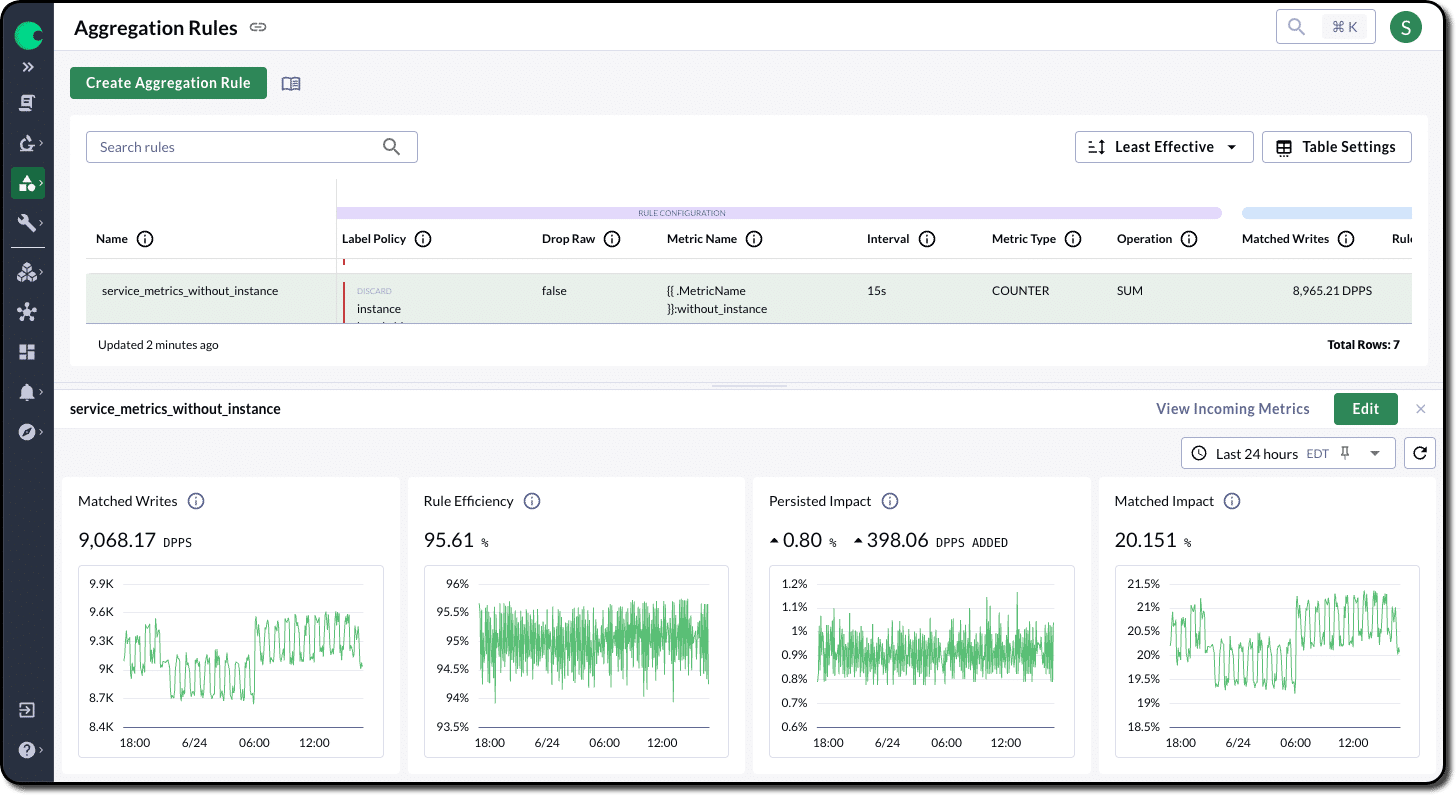
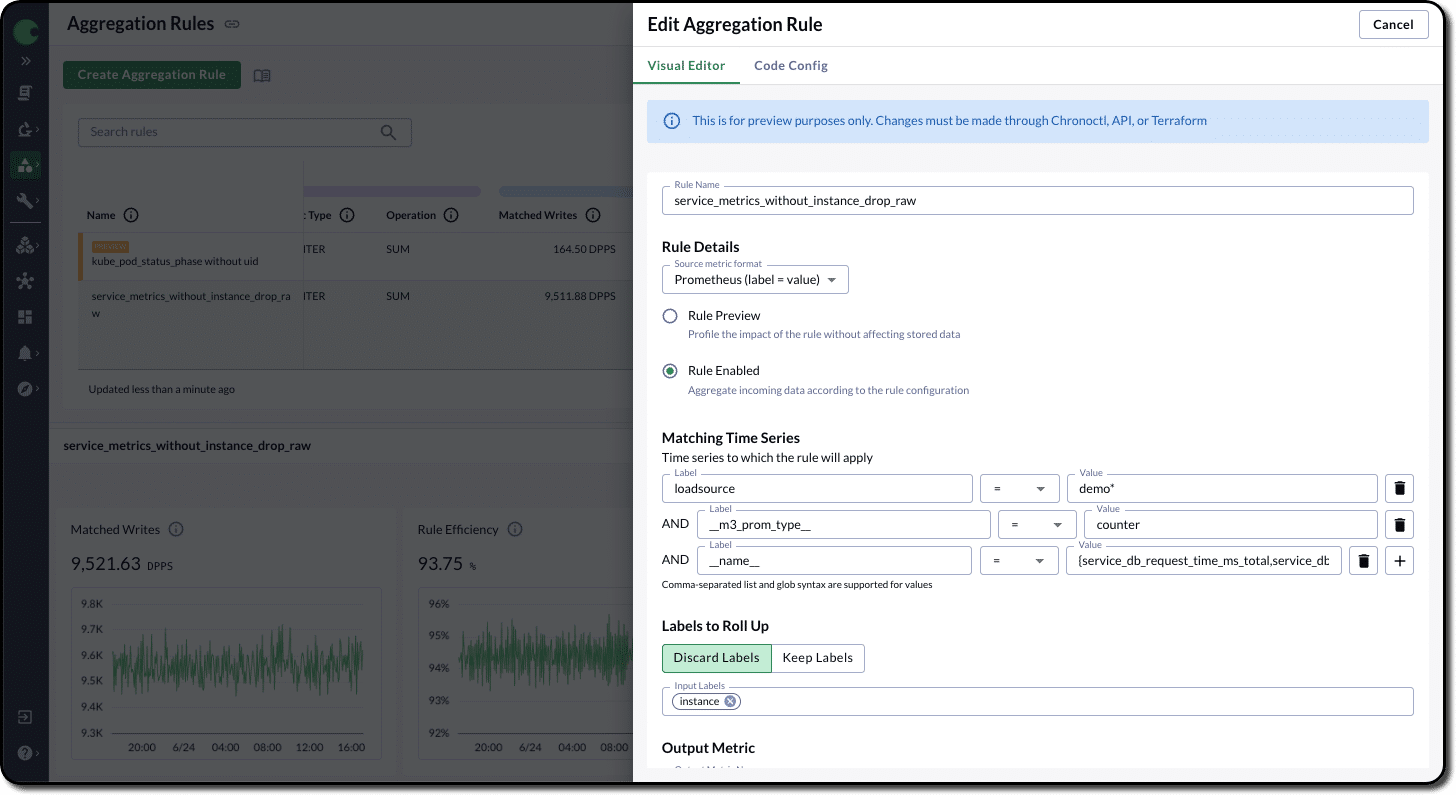
- Optimize metrics without code changes. Aggregate, downsample, remove high cardinality labels, and drop non-valuable data
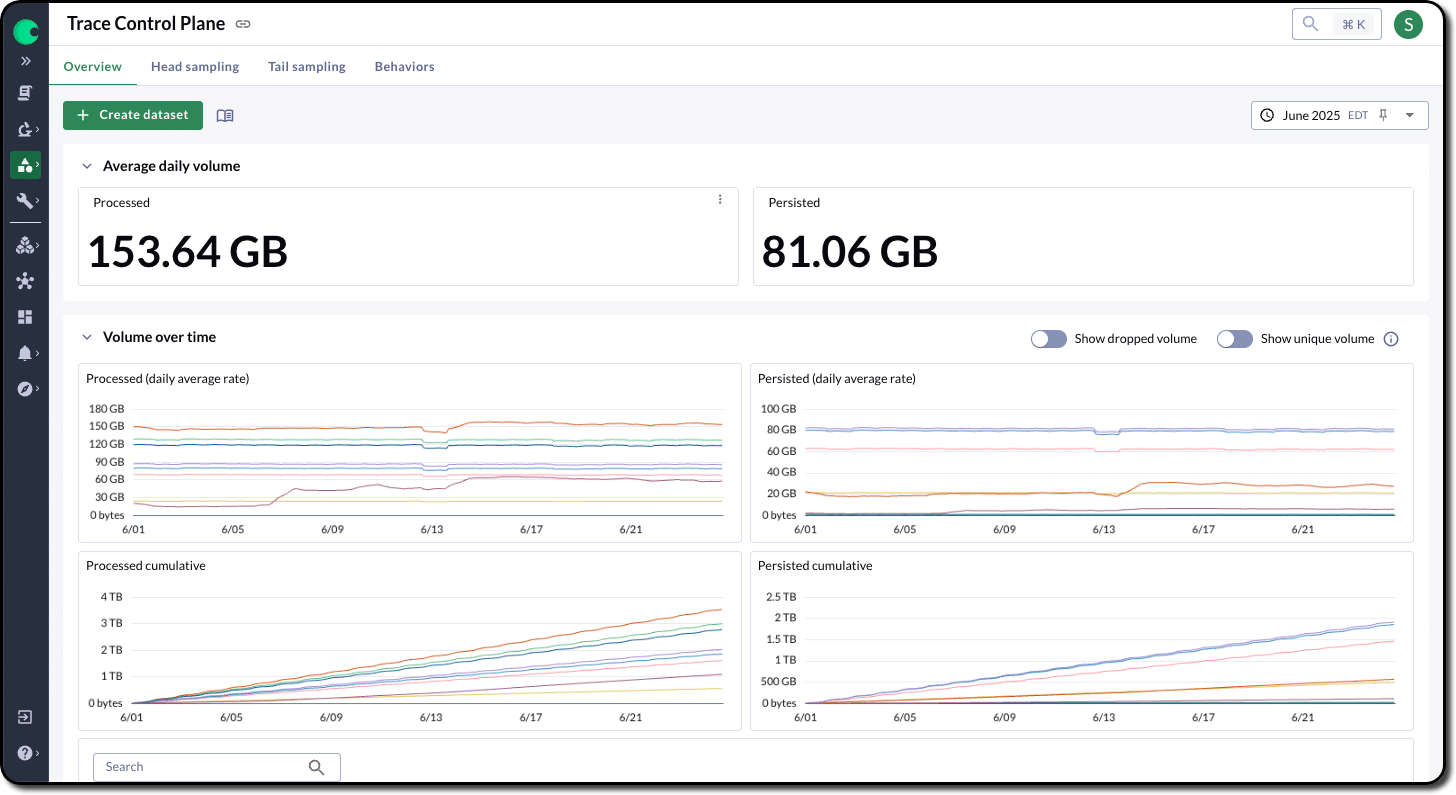
- Control trace costs dynamically. Apply head and tail sampling with flexible rate adjustments to keep valuable data while reducing waste
- Reduce logs in a matter of clicks. Filter low-value logs, remove white space, and convert logs to metrics instantly

Operate
Continuously optimize for efficiency and a better developer experience
- Spot optimization opportunities automatically. Identify ways to further optimize cost and performance across your data
- Keep dashboards fast always. Query Accelerator speeds up slow queries by automatically pre-aggregating your data
- Share query resources fairly. Query Scheduler prevents one user from crowding out other queries trying to execute

Ryan Sokol
VP of Engineering