Generation 1: the data center
Observability is one of the hottest topics in the technology world, but it is not new. The term dates back to 1960, when Rudolf E. Kalman described the concept of observability in the context of control theory.
Similar to the way anything that trends on social media attracts tens or hundreds of thousands of opinions, every management software vendor, media outlet and industry analyst is offering their unique take on observability. The result? Almost as many definitions as there are solutions. This is causing confusion, and traditional monitoring software vendors and even some well-intentioned analysts have contributed to the murkiness.
Monitoring and observability are related but not the same. I’ve written about the topic in the past so I won’t belabor the point here. To get beyond the theoretical definitions, it’s helpful to understand how we got to where we are today.
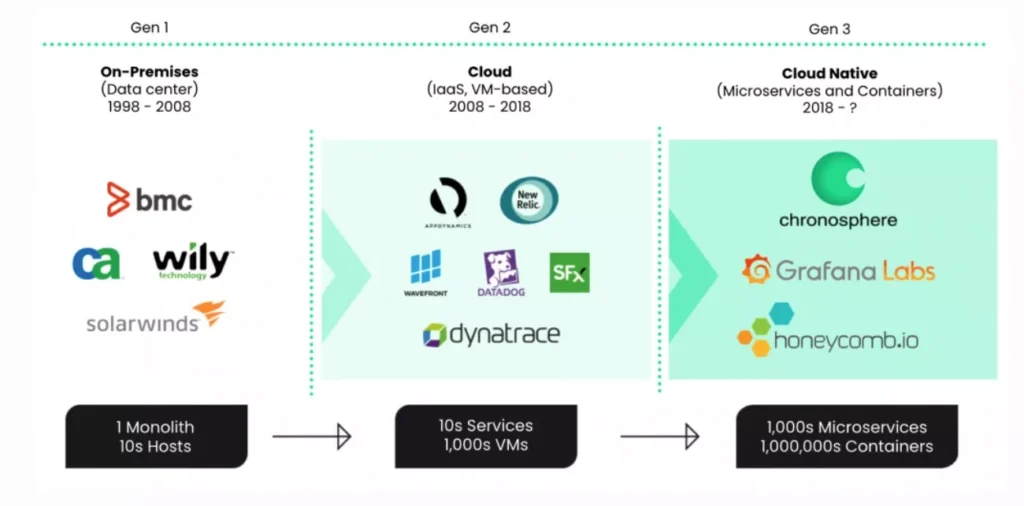
Starting in the 1990s, IT and systems management (ITSM) was dominated by the “Big 4”: HP, IBM Tivoli, BMC, and Computer Associates. Monitoring consisted of SNMP traps and agents installed on servers to more or less provide red/yellow/green status of physical servers, storage, and networking. Early application management vendors such as Wily (acquired by CA) and BMC owned the market for performance monitoring of the monolithic applications that ran on as many as dozens of servers in a data center. They dominated the market until virtualization and, eventually, cloud computing left them vulnerable to disruption.
Generation 2: the cloud
That disruption came in the form of a host of application performance monitoring (APM) tools designed for the new world of cloud services. Starting in the mid 2000s, enterprises were running thousands of VMs in their data centers across dozens of hosts. By 2011, they also began deploying public cloud services. Vendors such as New Relic, Dynatrace, and Datadog completely disrupted the Gen 1 vendors with APM platforms that provide visibility into the performance and availability of thousands of VMs and the applications running on them. For most early cloud workloads, simple performance and availability data was enough, and the siloed nature of their platforms wasn’t an obstacle to adoption. However, as organizations have scaled their cloud footprint and embraced DevOps methodology, APM tools can’t provide the scalability, reliability, and shared data insights required for cloud native scale and rapid application delivery. Much like their Gen 1 predecessors, they are facing an immediate, existential threat to their market position.
Generation 3: cloud native and emergence of observability
That existential threat comes from a new generation of monitoring solutions specifically designed for cloud native applications and infrastructure. A dramatic shift in cloud architecture started around 2018 with adoption of containers and microservices architecture. The distinction between cloud and cloud native is that cloud native applications are developed and deployed natively on cloud infrastructure using containers and microservices architecture. Cloud could simply be a lift and shift of a monolithic application to a cloud infrastructure. Containers and microservices architecture give developers unprecedented speed, flexibility, and scalability. Developers at leading companies deploy hundreds of software updates per day to respond faster to customer demand and market conditions and make their business more agile and responsive.
That speed and scale, however, has also ushered in a new era of complexity. Now, instead of thousands of VMs and dozens of services, application and operations teams must contend with millions of containers and thousands of microservices, some of which may only live for a few minutes. In addition, the shift to cloud native, along with the adoption of DevOps, means developers own responsibility for the operations of their applications, rather than throwing them over the wall to an IT Ops team. The Gen 2 tools, by virtue of their architecture, struggle to keep pace with the unique scale and capability requirements of this cloud native world. Gen 2 monitoring/APM collects predetermined data from individual applications and infrastructure components to provide performance and availability analysis. This data collection is determined by the APM vendor and the data they produce is locked into that vendor. The value of the data depends on the features of the APM tool.
Observability emerges to replace application and infrastructure monitoring
The ability to monitor for potential, anticipated issues that are largely determined by the APM vendor is no longer sufficient. Cloud native architectures are much larger in scale, more distributed and too interdependent to be limited by the APM vendor’s data collection. Developers need the flexibility to choose and control the data they collect and analyze. In addition, the scale of cloud native produces much higher cardinality data, which traditional APM struggles to collect and analyze.
Observability has emerged as a new operational paradigm. Observability solutions take whatever outputs a system makes available — log, traces, metrics, events — and provide insight to users that enable them to detect and remediate issues across the stack (infrastructure, applications, and the business). In contrast to monitoring, observability provides all the data in the proper context required to rapidly detect and remediate issues, and it puts the customer in control of what data to collect. Developers can collect more customized and specific telemetry for each service. Observability also allows developers to produce high cardinality data to better deal with the scale and complexity of cloud native. In Gen 3, observability data collection has gone from vendor-controlled to customer-controlled. The bottom line is that APM can alert engineers that there is a problem, but observability provides the detailed data in context for isolating root cause and fixing the problem.
Observability immediately affects engineering metrics such as mean time to remediate (MTTR) and mean time to detect (MTTD), time to deploy, etc., but can also provide real-time insights that help improve business KPIs such as payment failures, orders submitted/processed, or application latency issues that hurt the customer experience.
APM is table stakes; observability provides competitive advantage. APM is designed for the cloud; observability is designed for cloud native. As the world goes cloud native, observability will surpass APM as the dominant solution.
Why APM vendors can’t keep up (and sow confusion instead)
There are four main reasons that Gen 2 APM tools are simply not equipped for cloud native:
- Data volume – Each container emits the same volume of telemetry data as a VM. Scaling from 1,000s of VMs to millions/billions of containers results in an order of magnitude increase in observability data.
- Ephemerality – In addition to the sheer scale, containers are ephemeral in nature and may only live for a few minutes, whereas a VM’s lifespan can be months or even years. Gen 2 APM tools were not designed for this. DevOps teams need to reassess their assumptions about the value of their data in such a dynamic environment. It’s important to have the flexibility and control of your data for both short- and long-term use cases.
- Interdependence – In the world of monolithic apps and VMs, relationships between apps and infrastructure are predictable. In the cloud native world, relationships between microservices and containers are much more fluid and complex. Data cardinality is higher, and it’s much more challenging to connect the dots from applications to infrastructure to business metrics.
- Proprietary data formats – APM vendors create lock-in by using proprietary agents that ingest and store data in a proprietary format. Enterprises increasingly want compatibility with open source standards and they want to own their data. They also want to share and access data across department domains to better collaborate and detect and fix issues faster. Having data locked in proprietary silos hinders those efforts and raises costs.
Gen 2 vendors can’t completely rearchitect their solutions for cloud native. Instead, they’ve rearchitected their marketing and positioning. Those of a certain age will remember when traditional data center vendors responded to the growth of public cloud services by “cloudwashing” their offerings. Cloudwashing was simply rebranding existing solutions with the word “cloud.” It was often accompanied by some minimal technology enhancements such as moving a monolithic app to a VM. Similarly, Gen 2 monitoring vendors are “observability washing” by adding support for the 3 pillars of observability: logs, traces, and metrics, adding new pricing and packaging options, and rebranding themselves as “cloud” and “observability.”
To avoid confusion, focus on observability outcomes
This practice of calling everything “observability” has naturally created a lot of confusion in the market. The analyst community is trying to help, but each firm seems to define observability differently and place it in a different operational framework/context. In addition, their existing relationships with the APM vendors — who they are trying to help navigate through this generational shift — means they often start their analysis from the point of view that observability is an evolution of APM, rather than a disruption to it. But observability is disruptive because it is so architecturally different and uniquely addresses cloud native requirements. Again, it’s not about all the inputs such as logs, traces, and metrics, it’s about the production of sufficient data with context so issues can be quickly detected and remediated.
Most importantly, to really avoid the market confusion and definitional debates, we as an industry need to focus on outcomes. When properly implemented, observability drives competitive advantage, world-class customer experiences and faster innovation. The bottom line is rapid, more efficient remediation with measurable business impact. And that shouldn’t be confusing at all.


