Welcome to our November 2024 feature roundup at Chronosphere! This month, we’re excited to share updates designed to make observability more effective and customizable. Highlights include the Over Time mode for Differential Diagnosis, which helps teams correlate error trends with system events, and new support for Datadog normalization in OTLP metrics ingestion. Whether you’re exploring the latest Trace Explorer improvements or taking advantage of HTTP-based telemetry ingestion, these updates aim to provide more flexibility and clarity for your workflows. Let’s dive into what’s new!
Chronosphere Observability Platform
Now Available: Over time mode for Differential Diagnosis
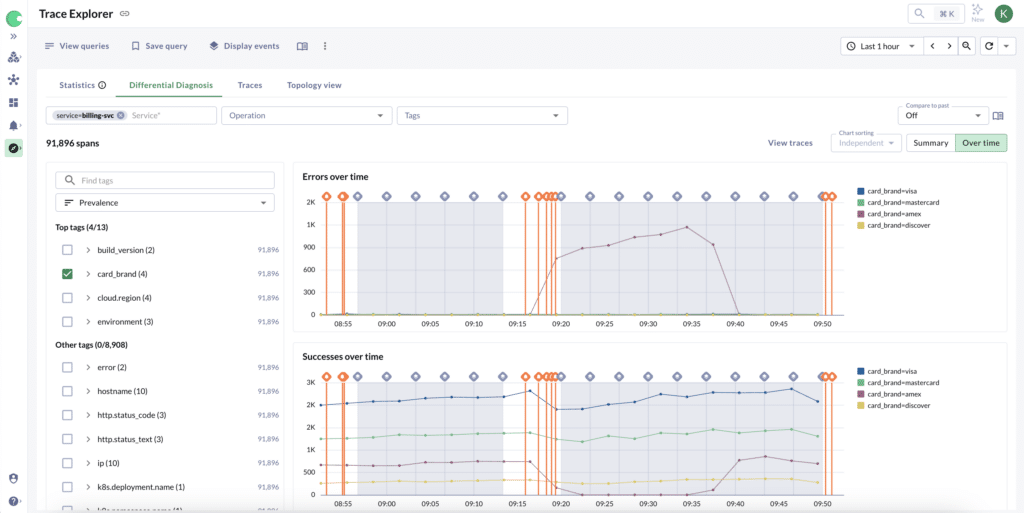
Chronosphere’s new Over Time mode in Differential Diagnosis allows tracing customers to better understand how specific tags correlate with errors or slowdowns over time. With this mode, users can visualize tag pairs (like cloud_region:us-west-1) that are unusually prevalent in error spans and align them with system events, such as deploys or feature flags. This correlation helps users quickly identify actions that might resolve ongoing issues, such as rolling back a recent deployment.
This feature is especially helpful for on-call engineers dealing with unexpected errors at inconvenient hours. For example, if an error surge in a specific region started shortly after a new deploy, the Over Time view allows users to make informed decisions, like reverting the deploy to stabilize the system. The goal is to give teams a clearer, time-based view of error trends, so they can take immediate action and revisit root cause analysis when it’s more convenient.
Now Available: Apply Datadog metric normalization to OTLP metrics
Chronosphere has added support for Datadog normalization in its OTLP metrics ingestion API. This feature ensures that metric and tag names, as well as their values, are normalized to align with Datadog’s naming conventions. For example, it removes leading numbers from metric names or replaces spaces in tag values with underscores. This normalization allows customers to continue using Datadog-based queries seamlessly within Chronosphere after migration, minimizing disruptions and ensuring consistent results.
This feature is particularly valuable for organizations using the OpenTelemetry Collector to transform DogStatsD metrics into OTLP format. By applying Datadog normalization during ingestion, Chronosphere ensures that metrics are aggregated correctly and queries return the expected results. This update makes the migration process smoother for Datadog customers, and reduces the need for extensive reconfiguration or re-instrumentation of applications.
Now Available: Trace Explorer improvements
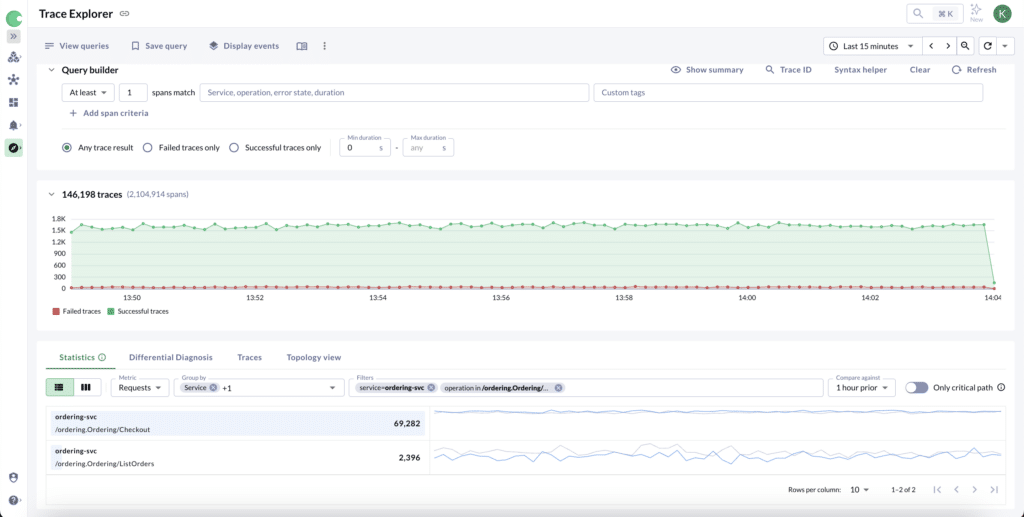
Chronosphere’s latest updates to the Trace Explorer query builder enhance usability and make it easier for users to find the trace data they need. Now, the service/operation field features a drop-down selector and autocomplete functionality, similar to what’s available in custom tag searches. This update helps users quickly locate and select the exact service or operation they want, especially for those new to tracing.
Additionally, users can now perform OR searches within specific tag values, making it simpler to locate traces across multiple tag options. For instance, users can query traces where the root_operation is one of several values, such as production, prod-1, or pr-live-bravo. This feature is especially helpful for environments with multiple naming conventions, because it allows users to capture all relevant traces across variations without needing multiple separate queries. Together, these updates make Trace Explorer’s query builder more flexible and user-friendly.
Now Available: OTLP HTTP endpoints
Chronosphere has announced availability for OTLP HTTP endpoints, which enables customers to ingest metrics and traces over HTTP. While OTLP gRPC endpoints have been supported for direct ingestion from OpenTelemetry, HTTP-based ingestion offers a flexible alternative for environments where gRPC is unavailable or less convenient. This new feature is particularly beneficial for integrations with tools like Fluent Bit and Chronosphere Telemetry Pipeline, making it easier to route telemetry to Chronosphere.
By providing additional options for telemetry collection, Chronosphere ensures that customers can adapt their observability workflows to diverse environments and requirements without additional infrastructure.
Now Available: Pool consumption metrics for persisted cardinality
Chronosphere has released the Persisted Cardinality Quotas dashboard, which provides customers with a clearer view of cardinality consumption across pre-defined pools and priorities. This new feature addresses a long-standing challenge for users trying to attribute cardinality costs to specific teams or services and pinpoint sources of growth. Previously, understanding cardinality consumption was limited to the cardinality_estimate function, which operated on a different definition of cardinality. Now, customers can break down their consumption data in a way that aligns with license reporting for better attribution and analysis.
By introducing pool and priority breakdowns, Chronosphere enables customers to prepare for more granular resource management. This update is particularly valuable for teams needing to monitor and control high cardinality traffic and understand growth trends. This helps them optimize resource usage while staying within their license limits.
Now Available: Trace details improvements
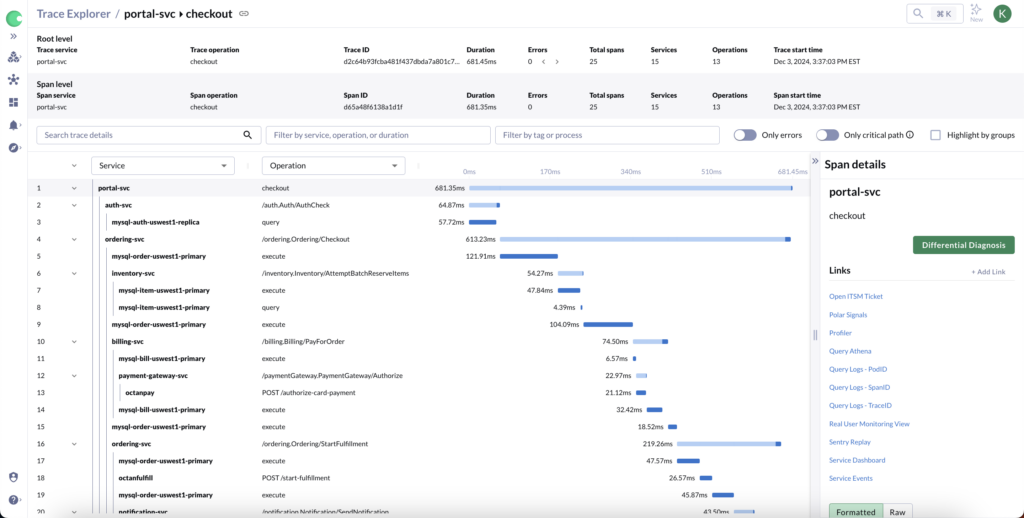
Chronosphere has introduced new enhancements to the Trace Details view that make it easier for users to filter and explore spans within a trace. Building on feedback from customers, the Trace Explorer’s full filter capabilities are now available directly within Trace Details. Users can filter spans by service, operation, or tag values, and apply conditions like duration thresholds or specific tag combinations. This makes it easier to focus on the spans most relevant to their analysis, such as identifying long-running operations or filtering out less significant spans like Istio calls.
Additionally, users can now customize how they browse a trace by replacing the default Service/Operation columns with any custom tag available in their spans. For example, users can browse spans by build versions or pod names to better understand specific details of a trace. These updates give users more control and flexibility when debugging complex traces, helping them zero in on the data that matters most.
As we wrap up this month’s feature roundup, we hope these updates make your workflows more efficient and adaptable. From the Over Time mode for Differential Diagnosis to expanded filtering options in Trace Explorer, each feature is designed to give you greater control and clarity in managing your observability data. We’ll continue to focus on delivering tools that address your needs and simplify your day-to-day operations. Stay tuned for more improvements next month!
Building an observability strategy your CFO will love
Read past feature updates


