
Software application development complexity has grown significantly over the past years, and that is just the tip of the iceberg. As more cloud native, serverless, and container-based applications are being developed, the ability of organizations to troubleshoot defects within these applications and meet service level agreements (SLAs) and mean time to repair (MTTR) targets is becoming more challenging. In an attempt to be prepared for application incidents in production, developers add more telemetry and observability data into their application during the development cycle.
Based on Chronosphere’s survey, there has been a 12.4X increase in observability data over the past year, with developers spending 25% of their time on troubleshooting. More data to consume means more time spent on troubleshooting, as well as more money spent on logging and telemetry. In addition, when an organization’s observability setup isn’t architected to quickly know, triage, and understand a problem, more time is invested in log data, which can be a costly and time-consuming pursuit.
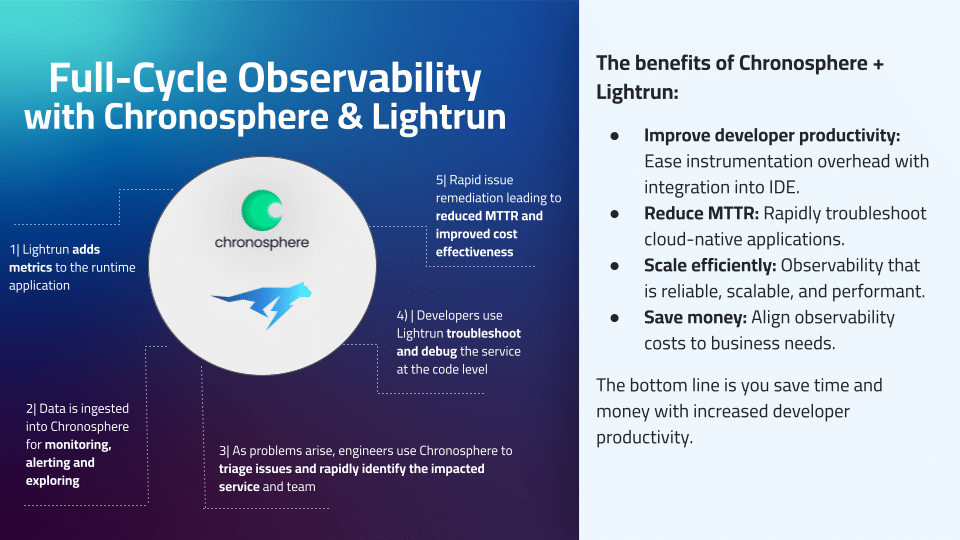
Chronosphere and Lightrun: Full cycle observability reimagined
To address the challenges in runtime troubleshooting and dealing with the growing scale of observability data that’s hard to consume, Lightrun, a leader in developer observability and cost optimization and Chronosphere a leader in cloud native observability, are partnering to provide a more optimized end-to-end observability solution.
To efficiently troubleshoot incidents in remote and distributed workloads like containerized applications or serverless, developers must have access to these environments from their native integrated design environments (IDEs). In addition, to reduce MTTR and solve the above-mentioned issues, developers need to also maintain the current state of the applications that they are debugging.
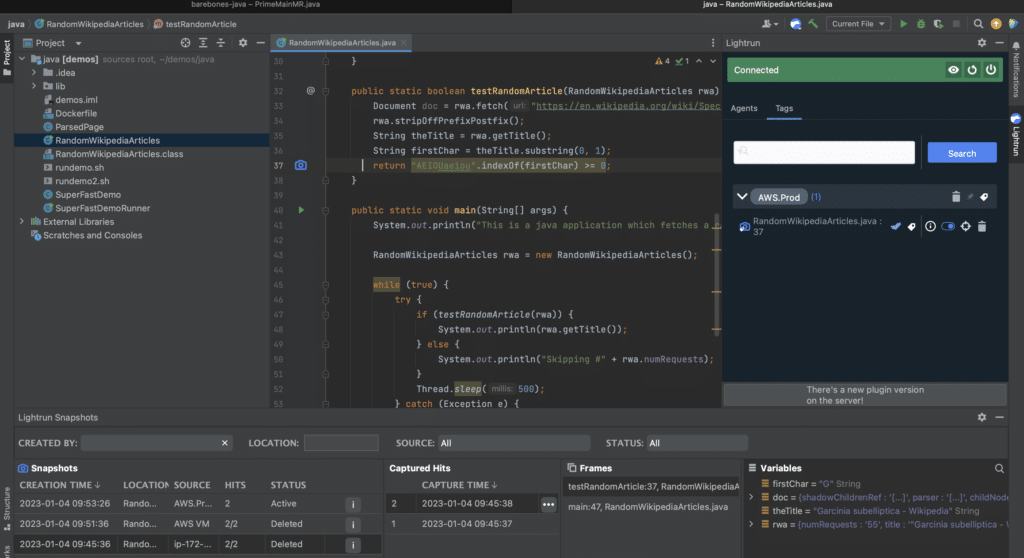
For that purpose, Lightrun provides developers with a native-IDE rich plugin with which they can add real-time logs, metrics, and also place virtual breakpoints (snapshots) to any running service or instance of the application regardless of its location. Whether the app or service is in production across a specific pod, or in pre-production, the developer has full visibility over the troubleshooting process and they can effectively get down to the root cause of the issue.
A core pillar of efficient debugging is the quality and relevancy of the observability data. Here, Chronosphere is able to collect data, metrics, traces and other telemetry from your cloud native applications and serve the developers with the level of visibility that they need to triage and troubleshoot this data. With Chronosphere’s ability to collect the right data and provide a centralized observability control and optimization pane of glass and with Lightrun dynamic logging and observability in runtime, developers and R&D managers can leverage a full cycle of observability.
Modernize your observability workflow with Lightrun and Chronosphere
When troubleshooting the most complex applications in runtime, gaining and visualizing the right data through the Chronosphere platform starts the process. Chronosphere ingests all emitted observability data, but helps you make sense of what is useful and what is waste, allowing you to fulfill your existing dashboard and alerting needs without having to store all the observability data in the raw form.
In contrast to traditional platforms that end up storing useless data for months and generating overwhelming information that is hard to consume and expensive, Chronosphere pre-processes the data and optimizes it, which reduces cost and improves performance. During an incident, engineers are rapidly guided to the most relevant observability data that helps them identify the impacted service. From there, they can connect directly from their local IDE via the Lightrun plugin to debug the live application deployment. With that, developers can understand the root cause of the issues, resolve them quickly, and close the cycle of the troubleshooting process.