Chronosphere Control Plane

Analyze and shape your observability data to control costs and deliver more business value.

Reduce Cost and Data Volume

With Chronosphere's Control Plane, customers see an average of:

%

Return on Investment

Observability is one of the most expensive items in your budget. Its cost is out of balance with the value it delivers. Stop making trade-offs that reduce visibility and increase risk.

%

Average Data Volume Reduction

Chronosphere allows you to get your observability data growth under control and helps you transform your existing observability tools and practice from a cost-center to a source of competitive advantage.

Manage-Runaway-Observability-Costs icon

How It Works

The Control Plane helps you reduce observability data volume, and cost, to improve performance and deliver more business value.

It’s built upon a framework required for success that we developed while working with leading cloud native companies. We call it the Observability Data Optimization Cycle.

Key Benefits

Reduce observability data volumes by 60% or more

Using shaping policies, the average Chronosphere customer uses the Control Plane to reduce their data by 60% while improving outcomes.

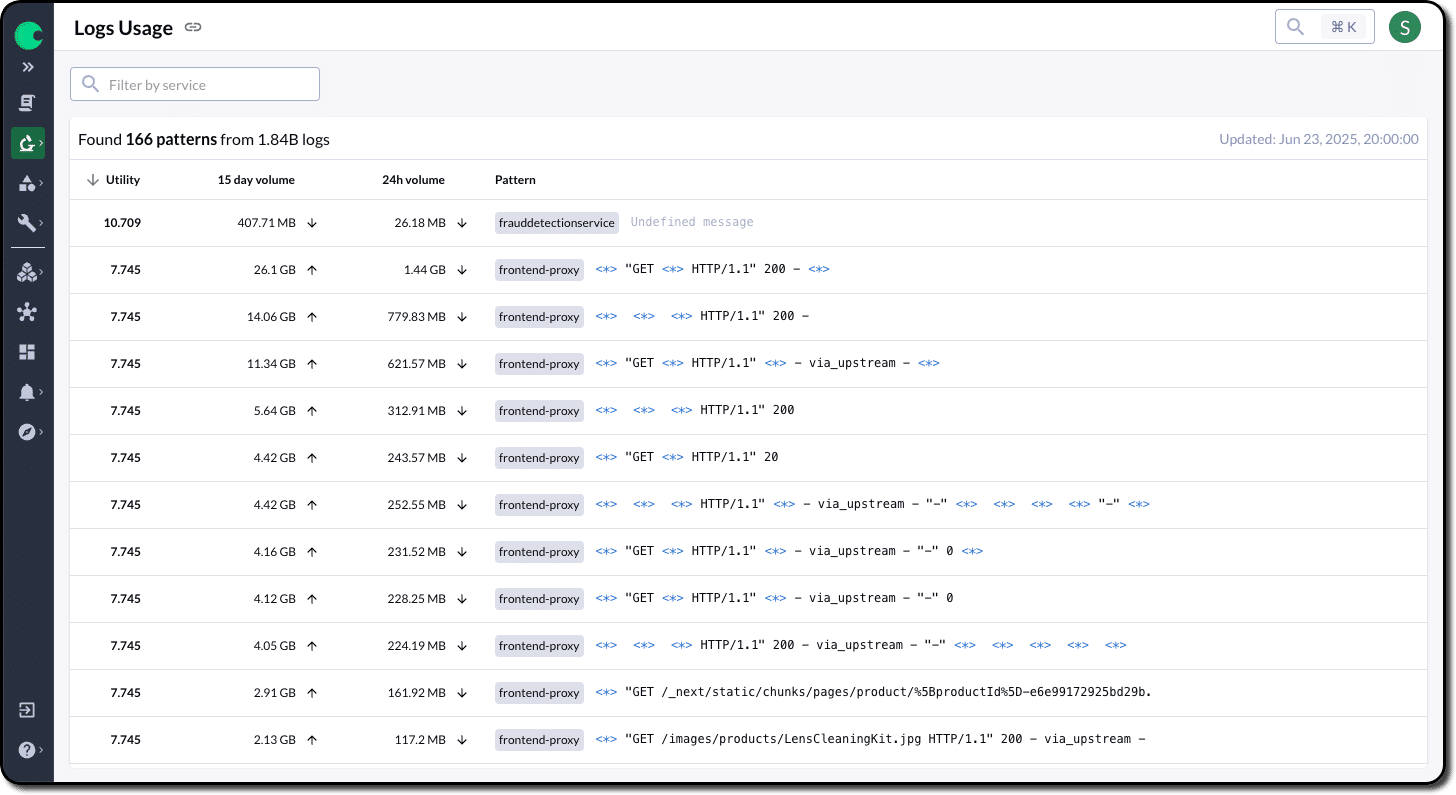
Easily identify and eliminate data that isn’t used and doesn’t deliver value.

Keep cost predictable and manageable, even as you scale

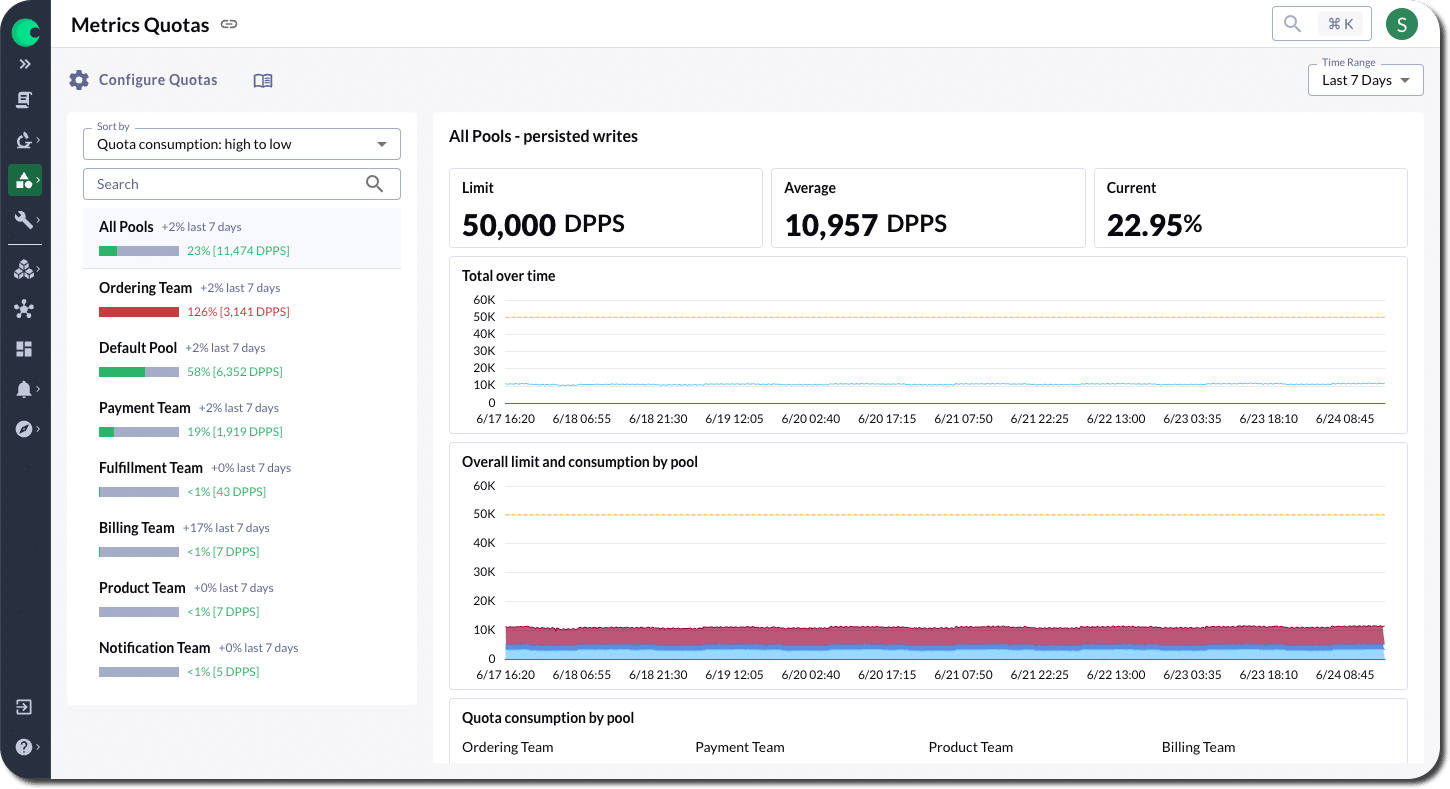
Eliminate unexpected overages and contain cardinality spikes by assigning quotas by team or service.

Empower teams to manage their own data with insights to the value of their data and the tools necessary to optimize it.

Reduce time spent troubleshooting by 50%

With data continuously optimized, engineers can find the data they need to solve problems faster.

Amplify underutilized high-value data to ensure the entire organization has access to it.

Features

Centralized Governance

Allocate priorities and drive accountability to mitigate high cardinality and control long term data growth

Protect against cardinality spikes and budget overruns

Quotas ensure each team/service uses their fair share. Teams can prioritize their metrics based on the value they deliver. Chronosphere provides the insights and tools to help teams make smart decisions about how to optimize their data to control growth.

Analyze

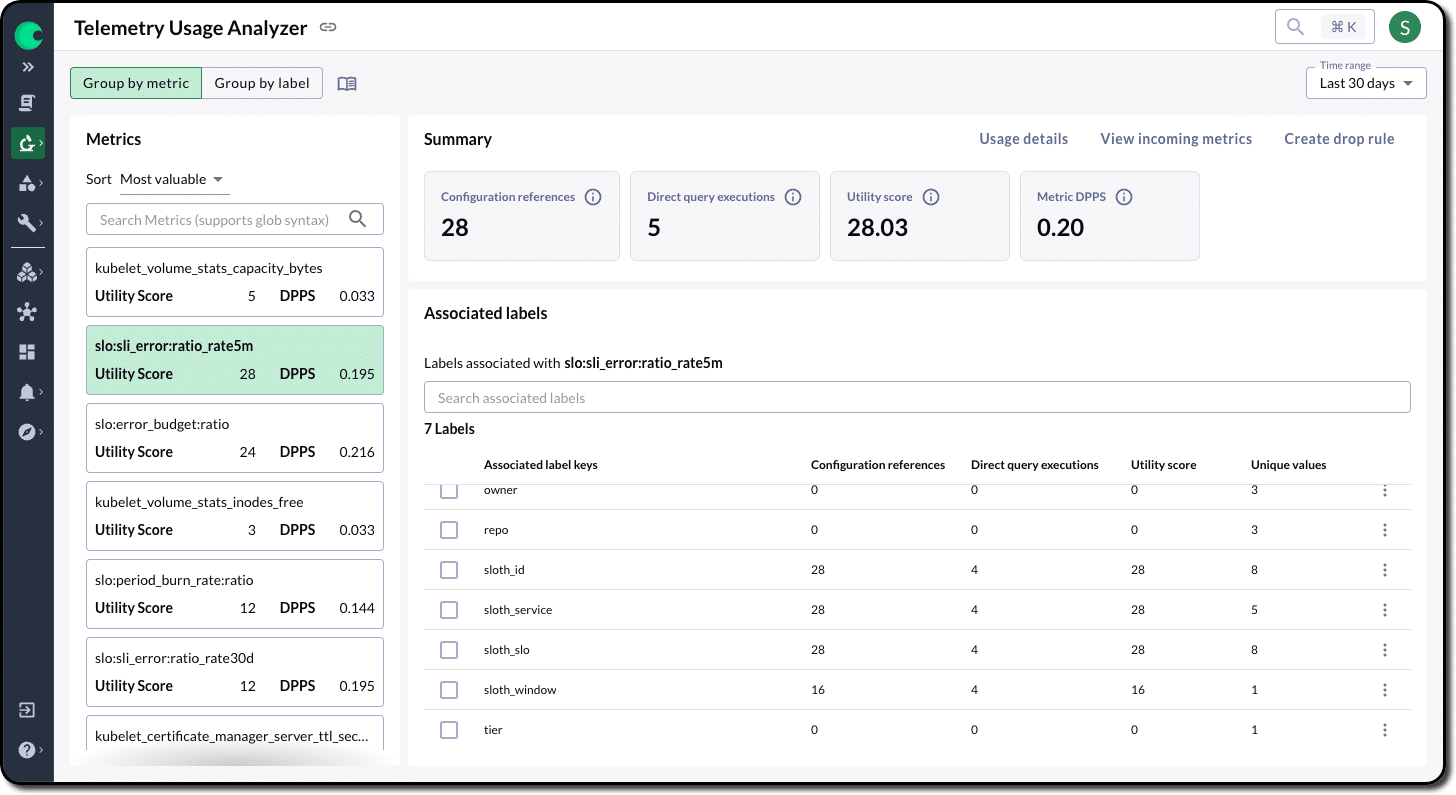
Analyze your data to understand usage and value

Understand the value of all the data in your system

  • Know what is useful and what is waste
    The Usage Analyzer provides insights into the cost vs. utility of each metric in your system. A utility score is calculated for each metric and shows you where it is used, how often it is used, and by whom, to help you make better shaping decisions.

Analyze Incoming data in real-time

  • Identify high cardinality metrics
    The Live Telemetry Analyzer allows you to see, in real-time, incoming metrics grouped by label, and their relative frequency. See which metrics have the highest ingest rate and the cardinality of the associated label to understand how they contribute to cost.

Test Drive the Control Plane

Refine

Shape & transform data to control costs and improve performance

Control Plane refine infographic
Control Plane Refine Capabilities
A wrench and a coin symbol, representing the concept of financial maintenance or repair.

Control cost by optimizing data sets

Apply shaping policies to eliminate waste and optimize data based on need, context, and utility.

A stylized graphic of a green atom with a blue star in the center, intersected by a banknote, symbolizing the concept of money in science or financial investment in technology.

Shape data dynamically

Implement and adjust shaping policies on the fly - No code changes or application redeployment needed.

Abstract illustration of an idea generation and decision-making process with shapes and a lightbulb icon.

Amplify useful data

Use Derived Metrics to store complex, high-value queries that everyone can use without adding to cost.

Operate

Continuously optimize for efficiency to ensure dashboards, alerts and queries are fast and deliver the information your developers and engineers need

A blue and green icon with a finger pointing at a control plane monitor.

Identify optimization opportunities

Identify opportunities to further optimize cost and performance.

A blue and green control plane icon with a cloud on it.

Always fast dashboards

Query Accelerator automatically speeds up slow dashboard queries by pre-aggregating the data.

A blue and green folder with a clock on it, representing the control plane.

Queries that execute when needed

Query Scheduler ensures query resources are shared fairly so one user can’t crowd out other queries trying to execute.

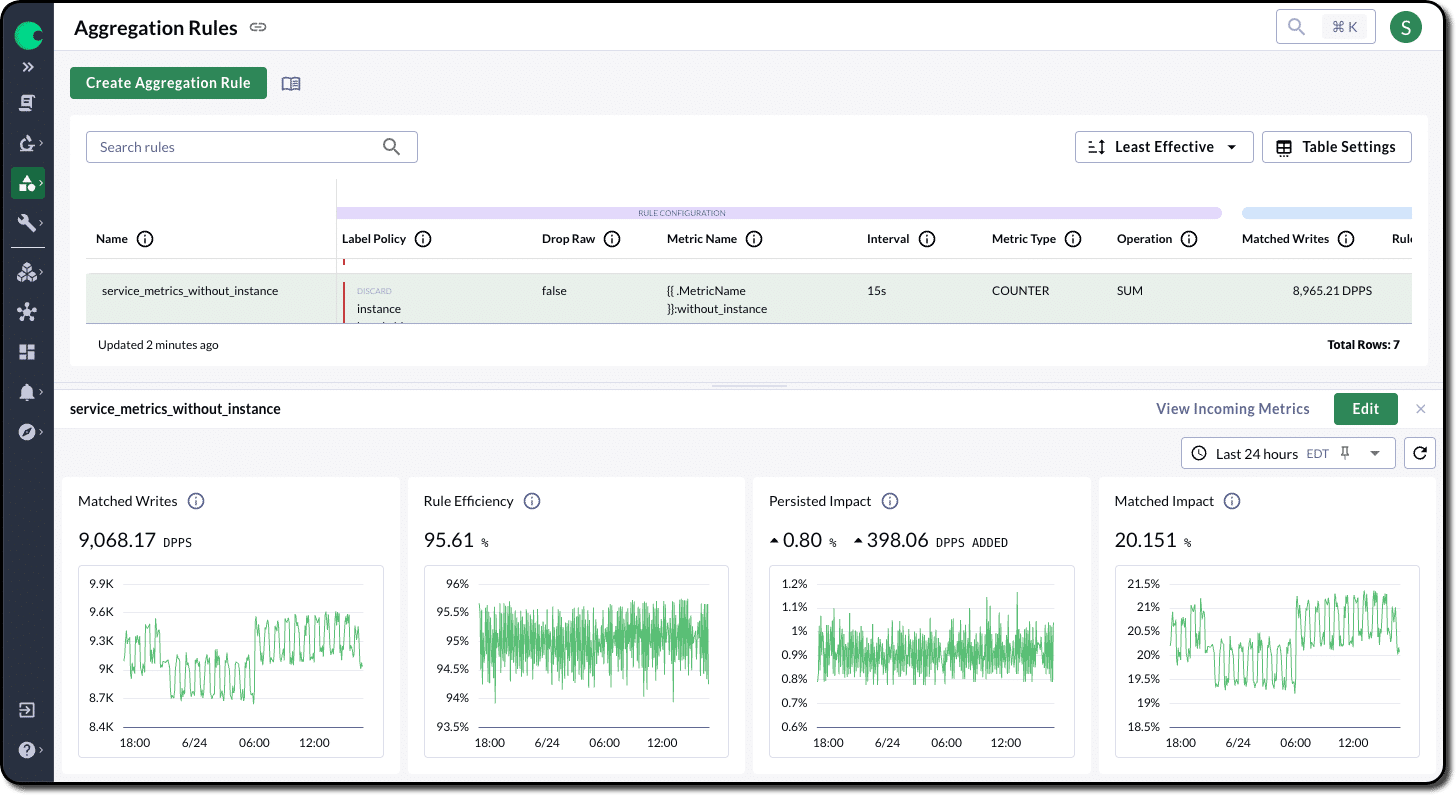
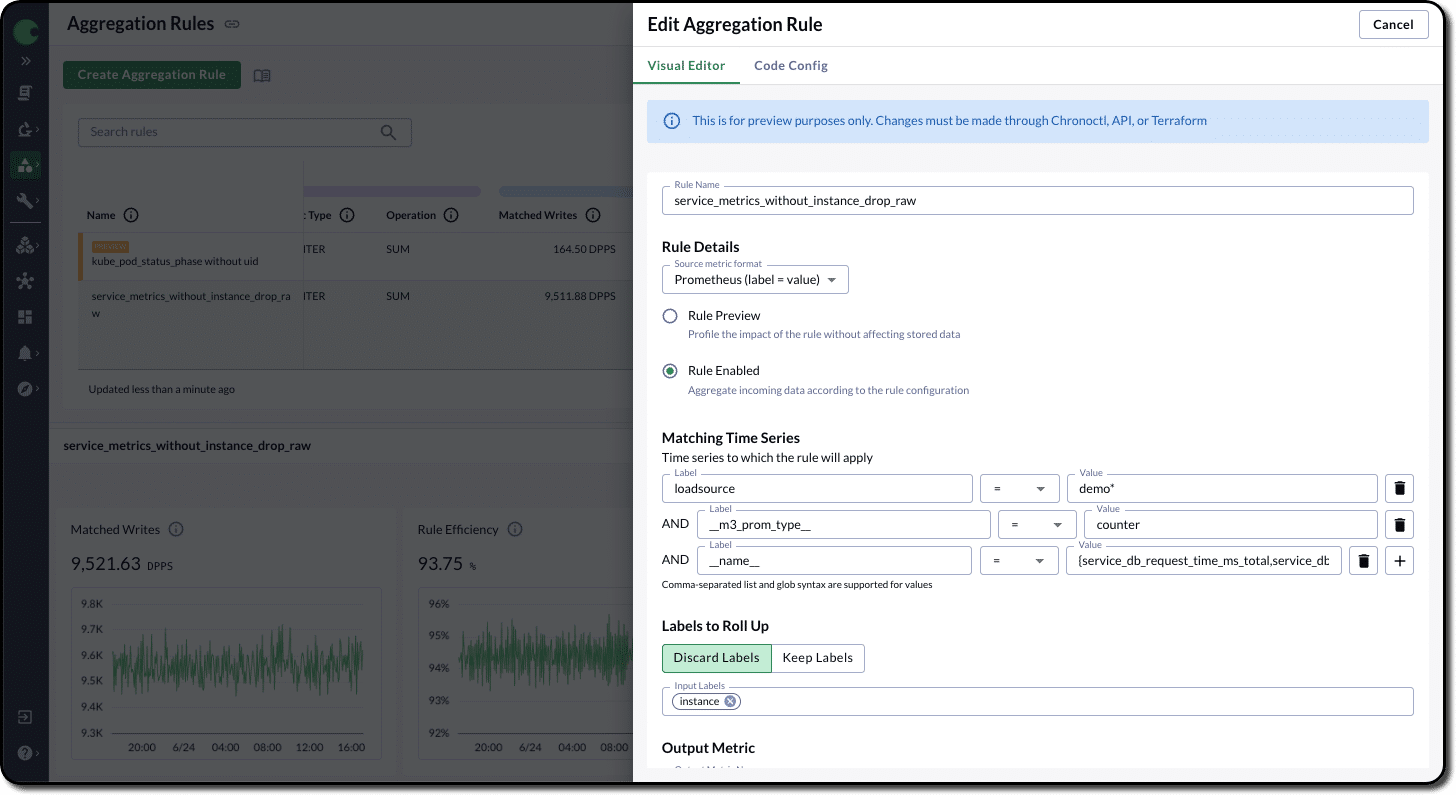
Easily identify inefficient shaping policies

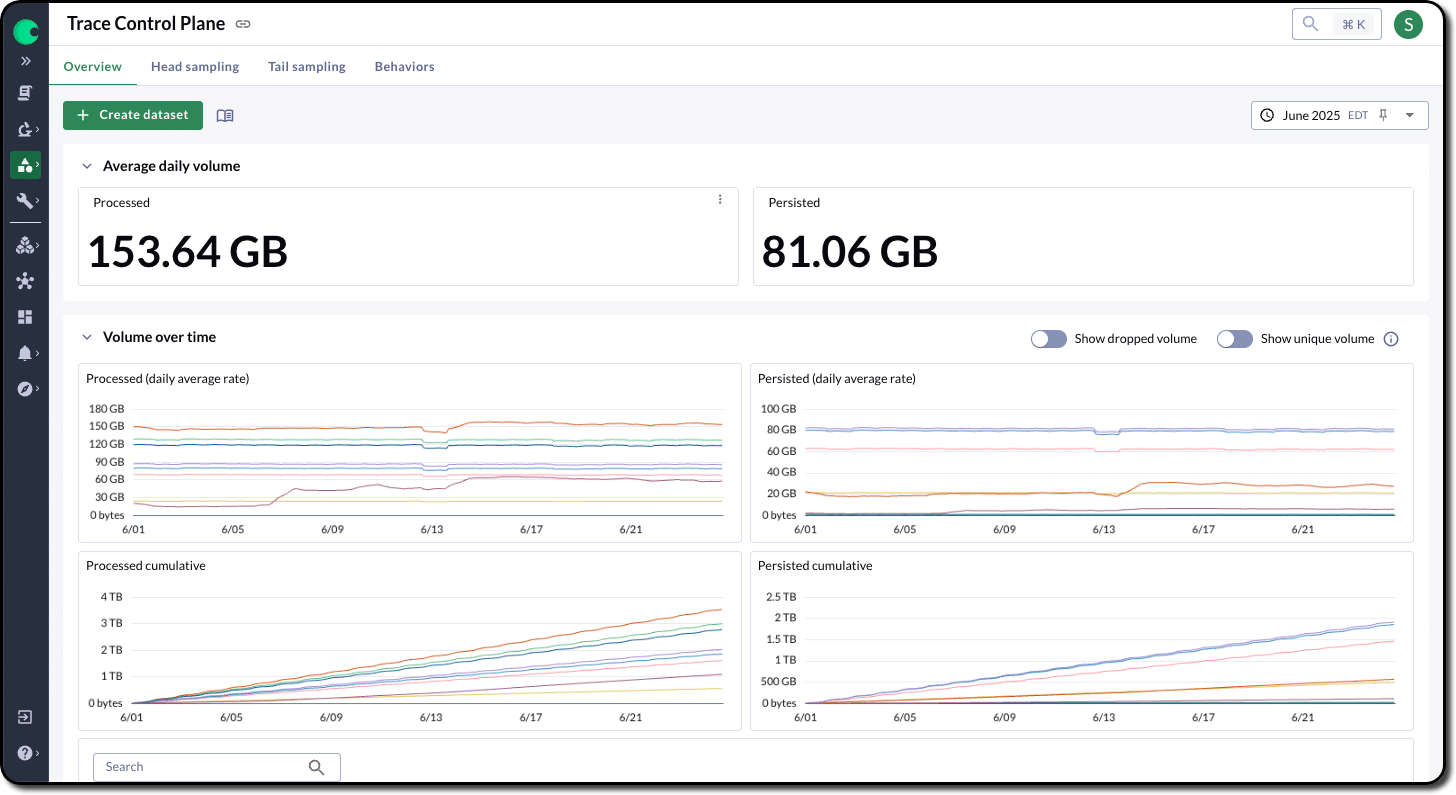
See how your shaping policies are configured and their impact

The Shaping Policies UI helps you quickly identify and understand the impact of your shaping rules. You can also preview the impact of a new rule before implementation.

Enabling a better on-call experience

Visualize engineering time saved

The Query Accelerator dashboard provides an overview of the amount of time your developers and SREs saved if their dashboard queries weren’t optimized.It also provides a comparison of average load speeds of accelerated queries vs. the original.

"Chronosphere’s game-changing platform gives us the visibility and control to manage our observability data, especially with our unprecedented growth.”

Ryan Sokol

VP of Engineering
Do More With Chronosphere

Chronosphere allows you to move observability from a cost center to a source of competitive advantage.

Leveraging a dedicated customer success team, Chronosphere will help you on Day 1 and moving forward to:

Day

Align your observability costs to the value it delivers:

Reduce your observability data volumes by 60%, on average

Remediate issues faster – Engineers spend 50% less time troubleshooting, on average

Optimized performance of dashboards and alerts

Day +

With data and costs under control, you are free to do more:

Expand visibility and coverage

Increase use of custom metrics to build meaningful software that delights customers

Use data-driven insights to optimize the value your observability data delivers

Benefits By Role

Platform Engineering Leader

Cut operational costs

Eliminate surprise overages & tough conversations with the CFO

Improve engineering productivity & satisfaction

SRE/Observability Leader

Gain visibility into expensive services

Delegate ownership of usage & budget to decentralized teams

Stop having partial coverage due to high cost

Developers/Engineers

Stop wasting time on metrics reduction projects

Instrument with confidence and without cost restrictions

Better on-call experience

Related Resources

Two business people shaking hands in front of a city discussing SLA.

See the Control Plane in Action

See how our Control Plane can reduce observability volume, lowers costs, and improve performance to deliver more business value.

Sign up today for our 1 on 1 demos or group deminars to get started.