")


How cloud native workloads affect cardinality over time?
When it comes to metrics, cardinality is an important topic. For those who are not familiar, cardinality in metrics refers to the number of possible time-series there can be, based on the dimensions the metrics have, and dimensions are the different properties of your data. Chronopsphere has written several articles on our blog related to high cardinality, understanding the cardinality in your workload, managing cardinality spikes, and more.
One thing that has not been covered well when it comes to cardinality is how important it is to understand cardinality over time. It’s quite common to see workloads that have perfectly manageable cardinality when looking at a point in time, but if you try to query metrics over a longer window, the performance is unacceptable, to the point where the underlying system may not even be able to handle requests for data.
In this post, we’ll discuss how to think about cardinality over time, introduce the concept of “churn” in a workload and consider how the ephemerality of cloud native workloads can affect long-term cardinality.
How to think about cardinality over time
First things first: How is cardinality over time different from cardinality at a given moment? It turns out that this is fairly straightforward. As we’ve noted before, cardinality is the number of possible groupings there are for the metrics we have.
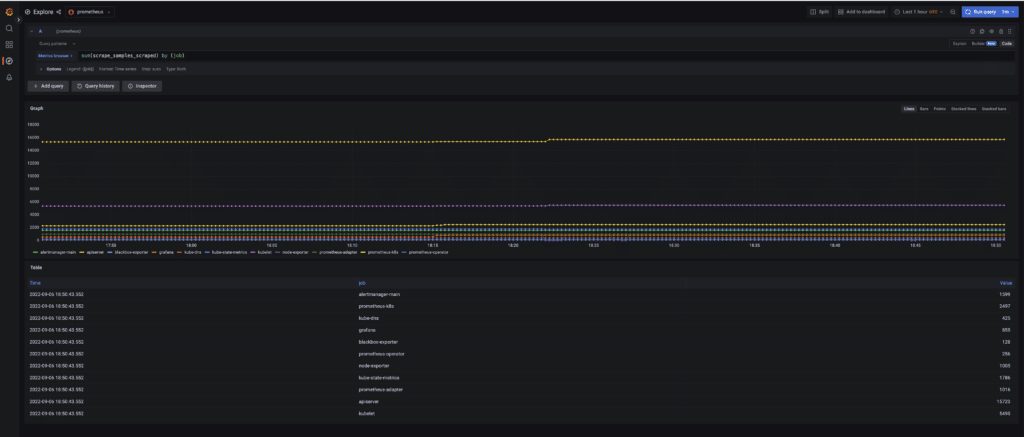
So, if we want to understand the cardinality at a given time, we just need to count how many time series there are. If you’re using Prometheus, we can calculate the cardinality of our workload at a given point in time using the expression `sum(scrape_samples_scraped{})`, which will tell us how many unique time series are being ingested across all of our scrape jobs.
How do things change when we’re looking at a window of time though? Well, we need to understand how many unique time series there are throughout the entire window. For example, let’s say we are measuring CPU usage across all of the containers for a particular service over the past hour. If you deployed a new version halfway through the hour, then to get a complete view of the hour, we’d need to fetch the series for the CPU running the old version of the service, as well as the series measuring CPU for the new version.
Another way to say this: If we are looking at a window of time and a time series stops reporting within that window, the cardinality in that window of time does not change, because we still saw the time series within the time window. What this means is that as our window of time gets larger, the cardinality of our data will only ever increase. The consequence is that the longer window of time we want to query and visualize metrics across, the more expensive it can potentially become.
Suppose you are using Prometheus and want to understand the cardinality of your workload over a window of time. In that case, you can monitor the `prometheus_tsdb_head_series` metric, which will track the number of unique series in the head block for the time-series database (a two-hour window by default.
Understanding ‘churn’ in workloads
Because cardinality increases over longer windows of time, it’s important to keep track of both the point-in-time cardinality of our workloads as well as the rate that it is increasing as we look back over the history of our metrics.
We commonly refer to the rate of change in cardinality over time as the “churn” of our workload — that is, how quickly new series are introduced into our workload. A workload with low point-in-time cardinality but high churn will tend to suffer from poor query performance the farther back in time users try to query, even more so than a workload that has high point-in-time cardinality, but low churn.
Some real-world examples of churn
So what kinds of workloads can have high churn? In truth, a number of things can produce churn, so most workloads will have some degree of churn. For example, every time you deploy a new version of a service, you will probably introduce new time series — and thus churn — into your workload.
Dimensions such as the instance of an application, its version and so on, can cause a newly deployed application to generate a spike of new time series, just as the old ones become no longer active. Other behaviors will cause slow leaks of churn in the workload that introduce new series continuously over time.
For example, if you have an application deployed in Kubernetes with horizontal pod autoscaling configured, then pods scaling up and down will create small amounts of churn with each new pod that is introduced. The most destructive examples come from metric anti-patterns, such as having dimensions that will have a unique value for (nearly) every request that an application handles. In such cases, workloads will have the maximum amount of churn and will cause stability issues in systems that are not designed to handle high cardinality.
Churn in cloud native workloads
Now that we understand the need to measure cardinality over time and how churn can affect it, let’s discuss how cloud native architectures affect cardinality and churn. Because cloud native workloads tend to have many short-lived, or ephemeral containers, they will naturally generate a higher degree of churn in our metric workload.
Everything from more frequent deployments across microservices, smaller-sized containers that scale up or down more frequently and intermittent jobs that run in the background will all naturally contribute to the churn that we can expect in our metrics and increase the amount of cardinality that we have to deal with over time.
The higher churn and resulting cardinality from cloud native workloads can easily overwhelm older time-series databases, which were designed with fewer, longer-lived time series than we see today in mind. Even when using newer TSDBs, it’s important to keep an eye on the cardinality of your workload over time, particularly if you want to be able to effectively look at long-term trends in your data.
Unfortunately, most TSDBs do not provide good visibility into this as part of their design. We noted how to understand the cardinality of your workload when using Prometheus earlier, but if you want to understand the cardinality for a subset of your data such as individual metrics, there are limited options to do so.
For Prometheus users, the only real option available here is via built-in functions like `count()` or `count_over_time()`. While these work to a degree, they are quite resource-intensive when it comes to higher cardinality series, exactly when we most care about having visibility into the behavior of our workload.
The only other option available to us is to keep a close eye on workload-level metrics like `prometheus_tsdb_head_series` to try and catch increases in churn when they are introduced. This again becomes impractical for organizations at scale, when there are multiple teams and many different services being monitored that need to be accounted for whenever there is a change in behavior.
Chronosphere delivers visibility and scale
Users of Chronosphere have an array of tools available to help them easily control the growth and cardinality of their data. In addition, our platform has been proven to scale to meet the needs of any cloud native workload and accommodate high amounts of churn efficiently as well.
If you’d like to learn more about how to understand cardinality over time and at scale, see how Chronosphere also provides visibility into cardinality over time for workloads efficiently, giving users the ability to dig into potential churn across any subset of their data in addition to the workload as a whole.


