Understanding Prometheus query language step and range queries
Prometheus query language (PromQL) is specifically designed for querying and aggregating Prometheus time series data but can exhibit behavior that may seem atypical when compared to traditional query languages such as SQL. Specifically, disappearing time series and spikes when changing query ranges.
Because Chronosphere metrics experience is based on the Prometheus data model and query language, familiarizing yourself with the rules and parameters the PromQL engine employs allows you to better utilise its capabilities to your own needs and achieve desired results.
This article dives into the fundamentals of PromQL — such as range queries, lookback durations, and staleness markers – and how you can use them to fix any anomalies that may occur.
Fundamentally, the PromQL engine supports two query types: instant and range.
Instant queries are evaluated at a specific moment in time and produce a single data point as a result. They are usually used in recording rules or monitors.
Range queries, on the other hand, are executed over a time range and result in an array of data points which are used to power dashboards. Conceptually, it helps to imagine a range query as a series of instant queries executed at a regular interval called step. Here is a visual example:
Disclaimer. Beware that in practice this mental model is not entirely true:
- Using @start() and @end() modifiers makes individual steps aware of the overall range start and end.
- At Chronosphere, we store downsampled data in long-term storage to keep costs reasonable. Adjusting the overall range might change whether the query uses raw or downsampled data, subtly changing data points fed into the Prometheus engine.
- A range query request is a lot cheaper to execute than many separate instant query requests.
However, this mental model is sufficient for the ideas presented in this article.
The step parameter controls how many data points are returned (and in turn the number of instant queries executed) from the range query. It is usually determined by the UI by evaluating what is the reasonable number of data points to draw on the screen for the given query range.
To give an extreme example, if we would like to have a step=30s for a 90-day range query, the PromQL engine would return 259,200 points. Even our computer monitor would not be able to visualize that many data points due to limitations in pixel count. To make the required computation and user experience appropriate, UI will send a request with a step set to 1h, which will result in 2,160 data points that are easier to visualize.
Lookback duration
Now let’s sprinkle some data points into our example. As usual in production, datapoints timestamps are not aligned to any particular minute or second:
Since the timestamps when PromQL evaluates instant queries are properly aligned according to the step and do not match the data points’ timestamps, the query engine has to somehow find a data point that is the most suitable for the given instant query evaluation.
At this point, we are ready to introduce another concept called lookback duration. To find the suitable datapoint for instant query, PromQL goes backwards — or looks back in time — until it finds a datapoint or until it reaches lookback duration. If the data point is not found, the evaluation returns an empty result. Here is another visual example:
A couple of important things to pay attention to:
- If there are no data points in the step size window, an instant query might use a data point from a previous window.
- If the step window has multiple data points, the closest one to the query will be picked.
Important note: real-world lookback duration value is always 5m when querying the raw data and is not configurable. The behavior of downsampled data is explained later.
Staleness markers
As can be seen in the previous example, lookback might accidentally prolong the lifetime of a metric which is no longer present by picking the datapoint value from previous windows.
This could be a problem when utilizing a metric like ALERTS, which indicates whether an alert is firing at the moment. Even if a specific alert is no longer active, due to the lookback effect, the ALERTS metric might still indicate that it is.
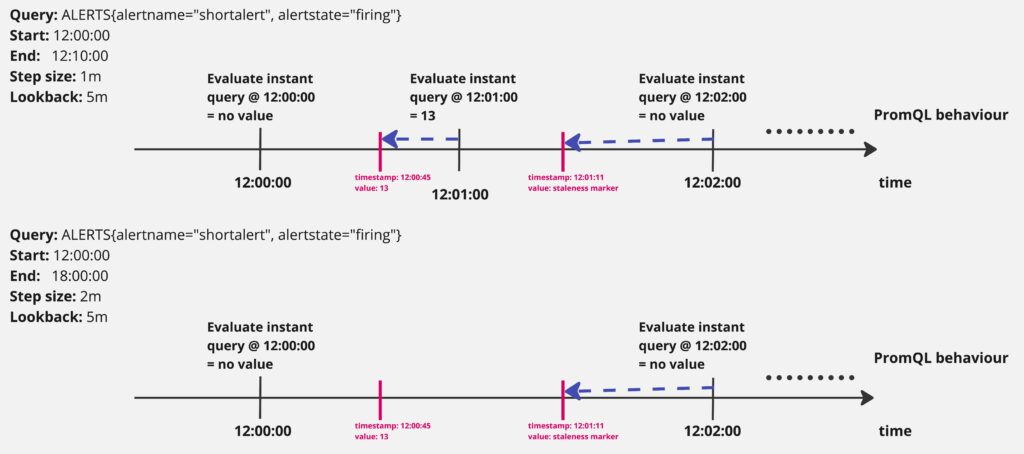
To address this issue, Prometheus added support for staleness markers. A staleness marker is a datapoint with a special value which is recognized across the Prometheus stack. Once the PromQL query evaluation encounters it, the query engine knows that the series is no longer present and it should stop searching for data points even if the lookback duration is not reached:
Important note: Staleness markers are not present for all metrics. Only the metrics which are produced by Prometheus itself (e.g. ALERTS, recording rules) or customer metrics which are scraped by chronocollector or Prometheus scraper with staleness markers configured. Metrics coming from other sources like OTel, or are converted from proprietary vendors do not have them.
Instant vs. range vector selectors
The previous paragraphs explain query behavior, which uses instant vector selectors. An Instant vector selector selects a single datapoint from a time series for the evaluation of the query at a given timestamp. They can be used standalone or in conjunction with some function. Here are some examples of how queries with instant vector selectors look like:
-
ALERTS{alertname="MemoryUtilisationHigh", alertstate="firing"} -
up{service="m3db"} -
sum(disk_utilisation)
-
max(cpu_utilisation) by (pod)
There is another type of selector which you have definitely encountered before: range vector selector. Range vector selectors are denoted by metric[range] syntax. They select all data points in the specified range and apply a mandatory function on them which produces a single data point. Probably the most popular example is rate(some_counter[5m]).
A query with the usage of a range vector selector can be visualized like this:
Manning Book: Fluent Bit with Kubernetes
Learn how to optimize observability systems for Kubernetes. Download Fluent Bit with Kubernetes now!
PromQL caveats and anomalies
Since we’ve covered the PromQL basics, we can now try to understand common situations when we experience PromQL anomalous behavior.
Disappearing time series when changing query range
There can be situations when we are investigating metrics and decide to increase the query range to get a broader picture. However, suddenly we find ourselves looking into an empty screen or noticing missing data points. This could happen if the data points are too scarce and the step is too wide compared to the lookback duration so the PromQL engine is not able to find data points:
Some series are short-lived and have only 1 or few data points and a following staleness marker. Series like that could trigger this behavior when changing the step too:
We overcome this issue by using range vector selectors which, as already explained, ignore staleness markers and allow us to specify the window to look at data points:
Lookback duration for downsampled data
At Chronosphere, we downsample old customer time series data points, so we can store them for a longer duration at a reasonable cost. Additionally, downsampled data is easier to process allowing us to support long-range queries.
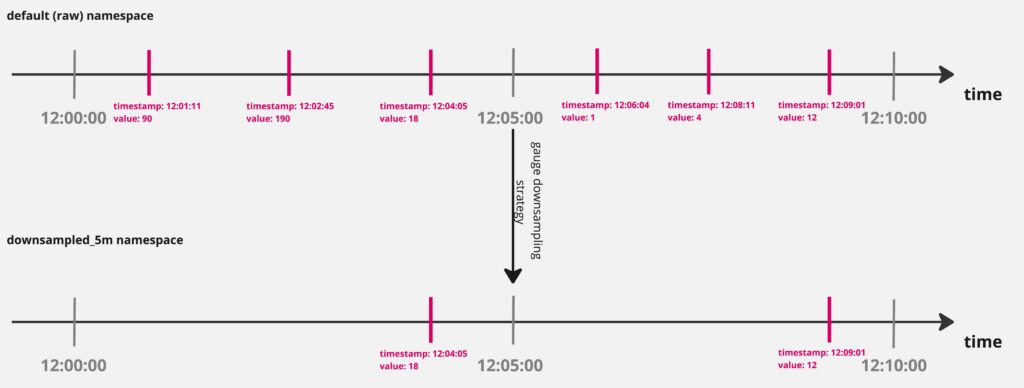
Here is an example of gauge metric downsampling:
In this example, the data points became very sparse, which can cause issues for PromQL — the default 5m lookback duration or the previously used range vector selectors might not collect enough data points to show meaningful results.
To not break existing queries when querying downsampled data, we dynamically increase the lookback duration used in the queries to 3 * downsampling resolution, giving us these values:
-
default (raw) data – 5m (default Prometheus value).
-
downsampled_5m – 15m.
-
downsampled_1h – 3h.
Additionally, we inspect every range vector used in the query and transparently adjust them as well to be at least 3 * resolution too.
Important to note that these adjustments are best-effort to keep downsampled data results similar to the raw ones. However, it is expected that some functions (e.g. increase) will produce different results when the query’s lookback is expanded. This means users should plan their queries accordingly if they are planning to process older data.
Disappearing spikes when increasing the range
Another common issue encountered while investigating spikes in metrics and broadening the query range for historical insights is the disappearance of spikes. They could happen for several reasons:
1. Peak data points are downsampled
Since our downsampling strategy for gauges is to take the last data point in the configured resolution (e.g. 5m, 1h), oftentimes the “interesting” data points that recorded the short spike in the metric are discarded. Check the example above for visualization.
Expanded query range might be served by the downsampled data, therefore, scoping the query range to raw data retention (5 days by default) might bring back the fidelity.
2. Peak data points are hidden by the increased step
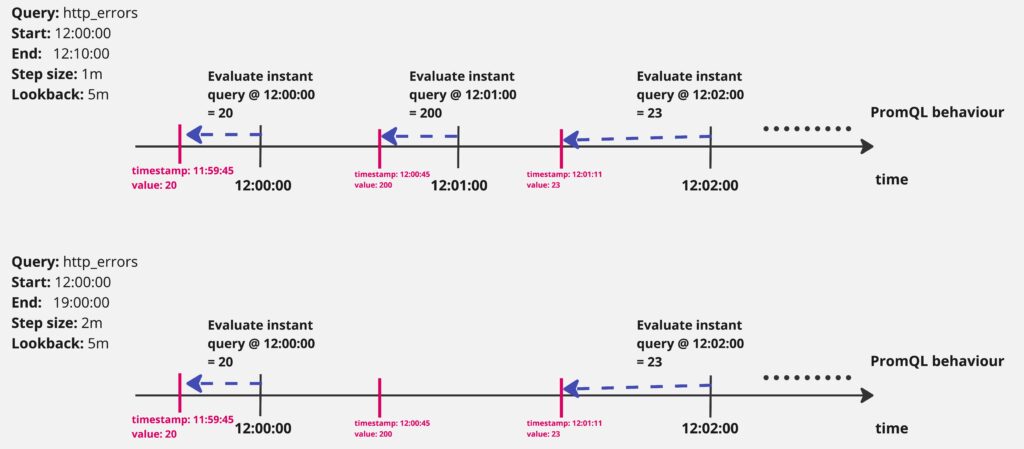
The reason is very similar to the “disappearing time series” problem — peak data points are hidden by the increased step and the lookback mechanism picking more recent data points instead:
This can be solved by using a range vector selector with a maximum function, e.g. max_over_time(http_errors[5m]).
Then, we verify that the wanted step was sent to the backend in the network tab in the browser Developer Tools:
Here we’re able to confirm that the changes you made to the step parameter are in place and can see how they affect the PromQL query, or if we need to dig further to troubleshoot the issue.
Overall, knowing about the fundamental components of PromQL – step and range queries, lookback, staleness markers, and vector selectors – makes it much easier to identify disappearing data and query spikes when they occur and how to fix them.
Additional resources
Blogs by Julius Volz, co-founder of the Prometheus monitoring system
- 5 reasons Prometheus is a natural fit for cloud native monitoring
- How to use Prometheus to monitor your services on Kubernetes
- Top 3 queries to add to your PromQL cheat sheet
- How to address Prometheus scaling challenges
- What you need to know before using OpenTelemetry with Prometheus
- The importance of compatibility when choosing a Prometheus vendor
Whitepaper: Getting Started with Fluent Bit and OSS Telemetry Pipelines
Getting Started with Fluent Bit and OSS Telemetry Pipelines: Learn how to navigate the complexities of telemetry pipelines with Fluent Bit.


